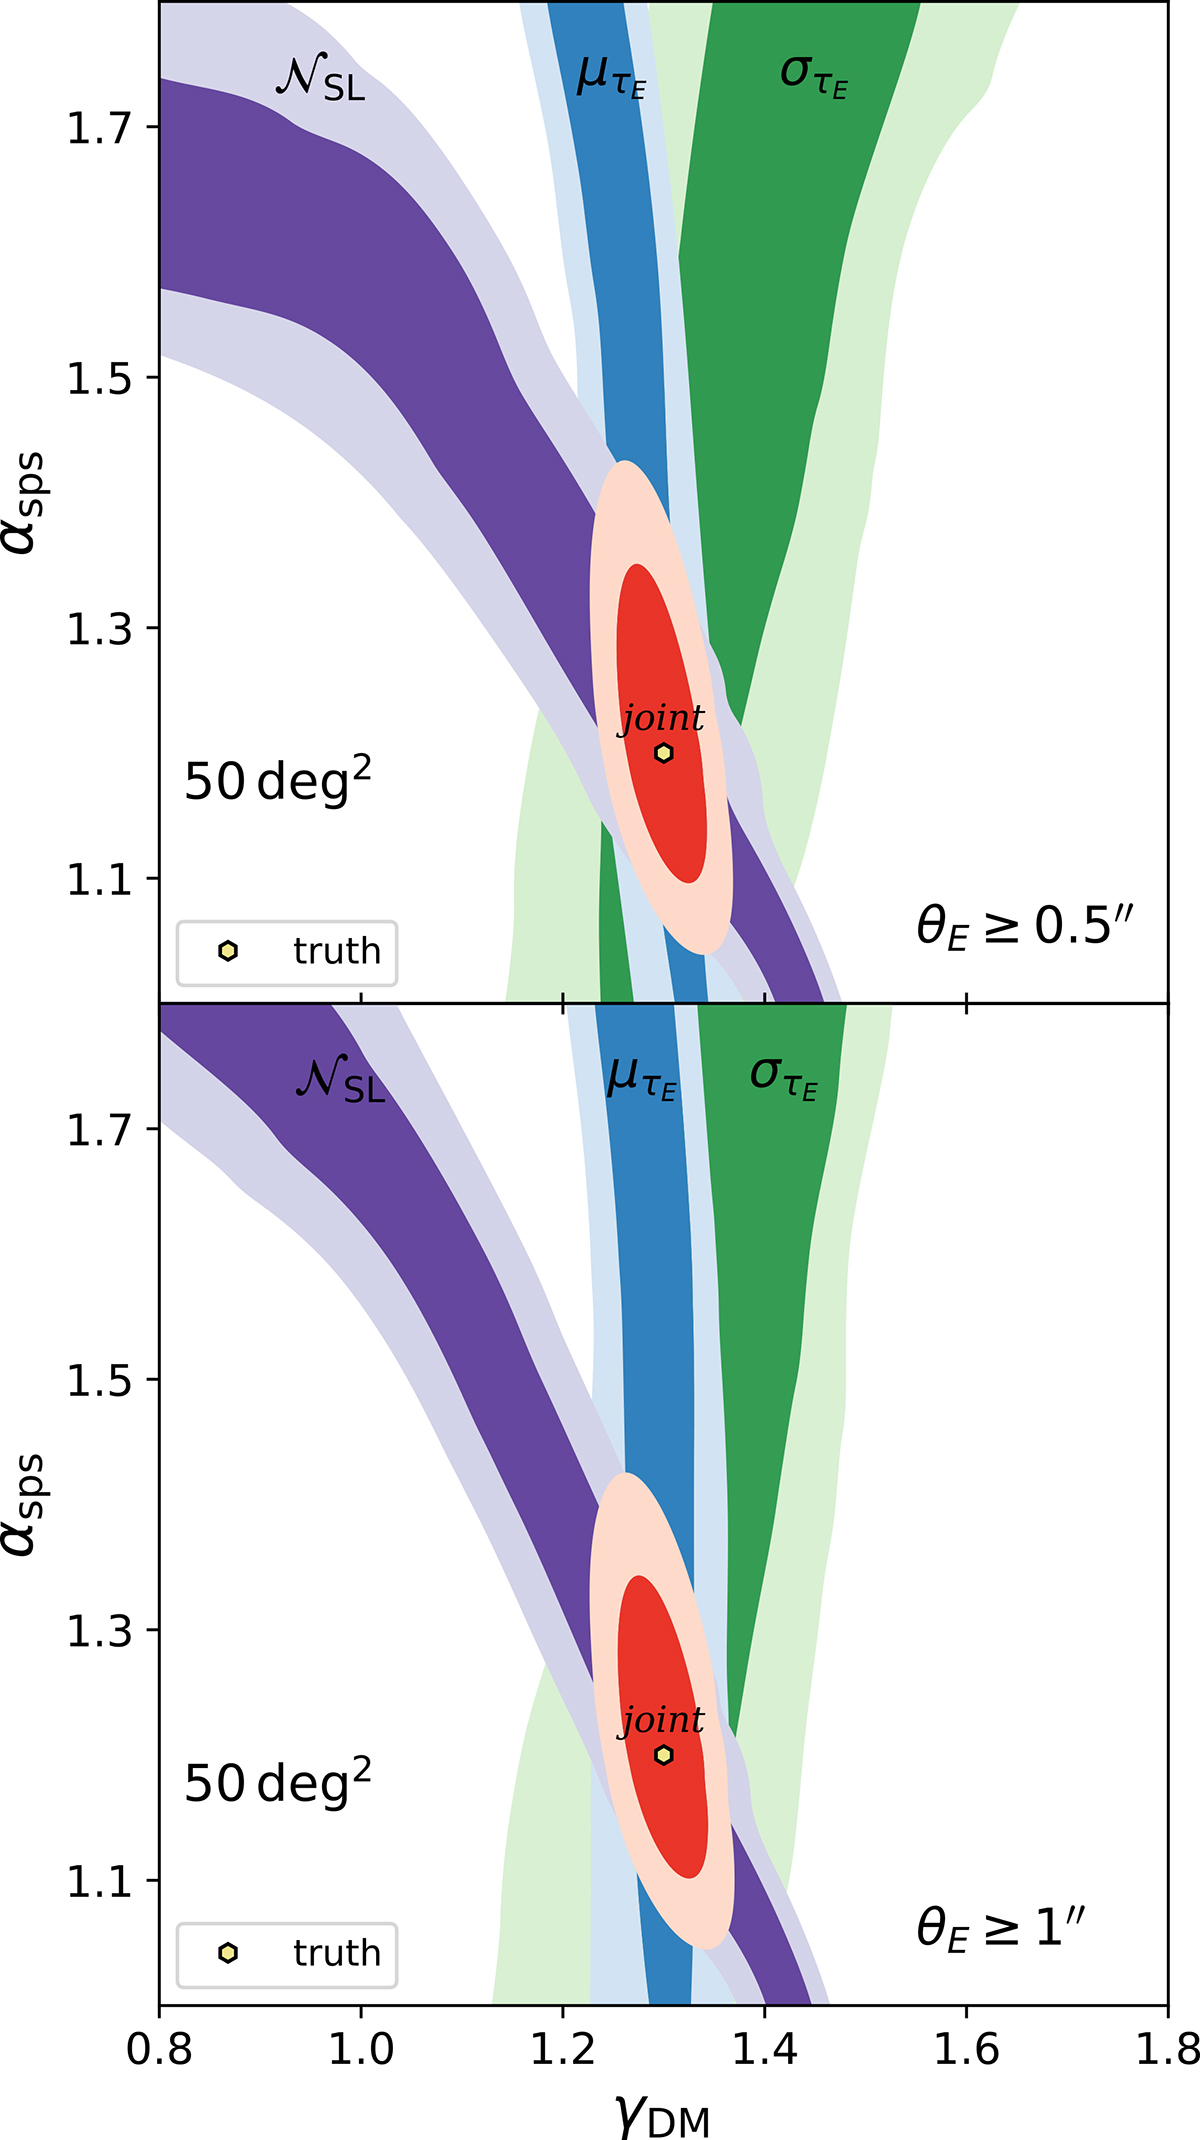
Fig. 4.
Download original image
Posterior distributions of the lenses with θE ≥ 0.5″ (top) and of θE ≥ 1″ (bottom), obtained as described in Sect. 3.1. The two-level contour lines show the 68% and 95% probability masses, with the purple showing the constraint by 𝒩SL, the blue by μτE, and the green by στE. The red filled contours show the joint constraint of the other three.
Current usage metrics show cumulative count of Article Views (full-text article views including HTML views, PDF and ePub downloads, according to the available data) and Abstracts Views on Vision4Press platform.
Data correspond to usage on the plateform after 2015. The current usage metrics is available 48-96 hours after online publication and is updated daily on week days.
Initial download of the metrics may take a while.