Fig. 1

Download original image
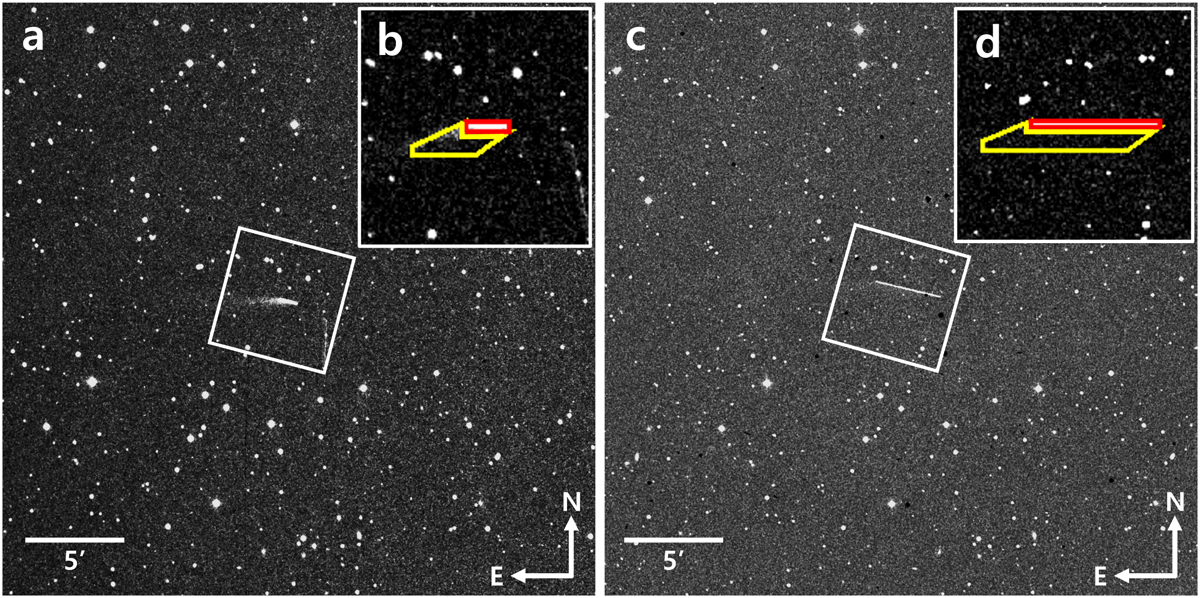
Digitized photographic plate images of WH in 1949 used for the analysis. (a) and (c) are the blue and red plate images taken with exposure times of 720 seconds and 2700 seconds, respectively. In these images, the nucleus and tails are stretched out due to the sidereal tracking mode of the telescope mount. The tail in the red plate image is not as clear as the one in the blue plate because of the lower sensitivity of the red plate. (b) and (d) are zoomed images within the white squares of images (a) and (c). These images are rotated to align the WH’s velocity vectors in a horizontal direction. The areas surrounded by red rectangles indicate the region for the nucleus photometry, while those surrounded by the lower left parts of the red rectangles and yellow lines indicate the region for the tail photometry.
Current usage metrics show cumulative count of Article Views (full-text article views including HTML views, PDF and ePub downloads, according to the available data) and Abstracts Views on Vision4Press platform.
Data correspond to usage on the plateform after 2015. The current usage metrics is available 48-96 hours after online publication and is updated daily on week days.
Initial download of the metrics may take a while.


