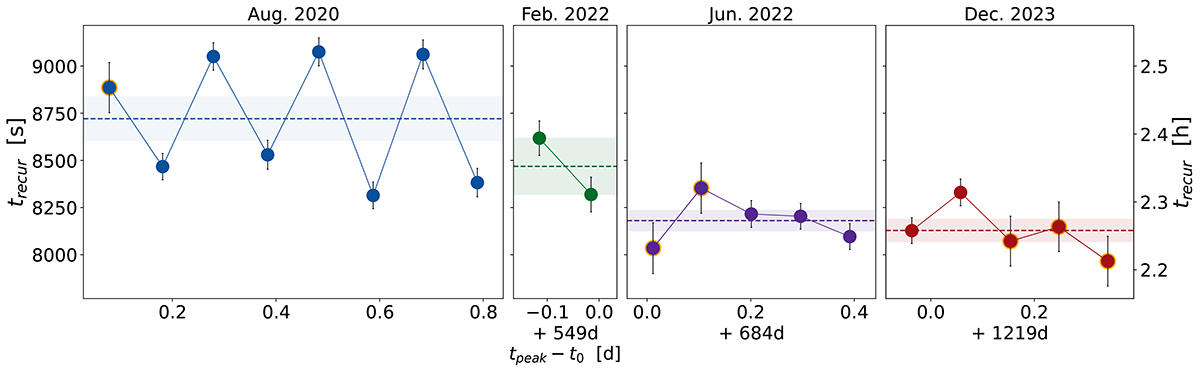
Fig. 2.
Download original image
Evolution of the recurrence time between eruptions over the ∼3.3 yr baseline. The start time t0 represents the start of the August 2020 observation. Data points with an orange contour contain an additional systematic uncertainty, as is described in the text. The mean value in each epoch, with an associated standard error of the mean, is shown with a dashed line and shaded contours.
Current usage metrics show cumulative count of Article Views (full-text article views including HTML views, PDF and ePub downloads, according to the available data) and Abstracts Views on Vision4Press platform.
Data correspond to usage on the plateform after 2015. The current usage metrics is available 48-96 hours after online publication and is updated daily on week days.
Initial download of the metrics may take a while.