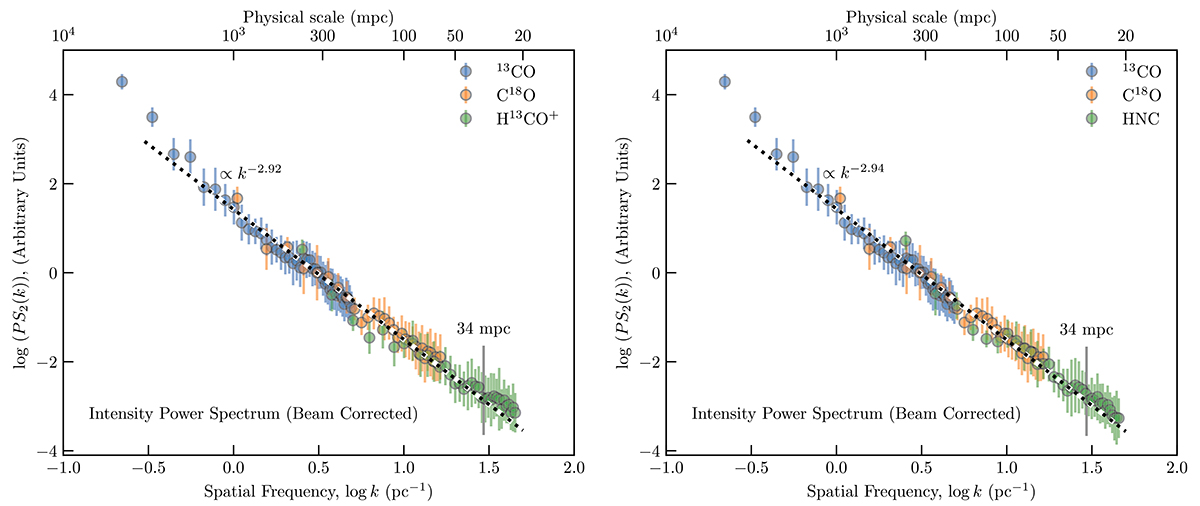
Fig. 2.
Download original image
Combined power spectrum of the three different datasets. The left and right panels respectively show the power spectrum with ion and neutrals at the smallest scales. The estimated MHD cutoff scale, 34 mpc, is marked by a vertical line. The fitted power law is shown by the dotted line, with exponents of β = 2.92 ± 0.11 and 2.94 ± 0.11 for the left and right panels, respectively.
Current usage metrics show cumulative count of Article Views (full-text article views including HTML views, PDF and ePub downloads, according to the available data) and Abstracts Views on Vision4Press platform.
Data correspond to usage on the plateform after 2015. The current usage metrics is available 48-96 hours after online publication and is updated daily on week days.
Initial download of the metrics may take a while.