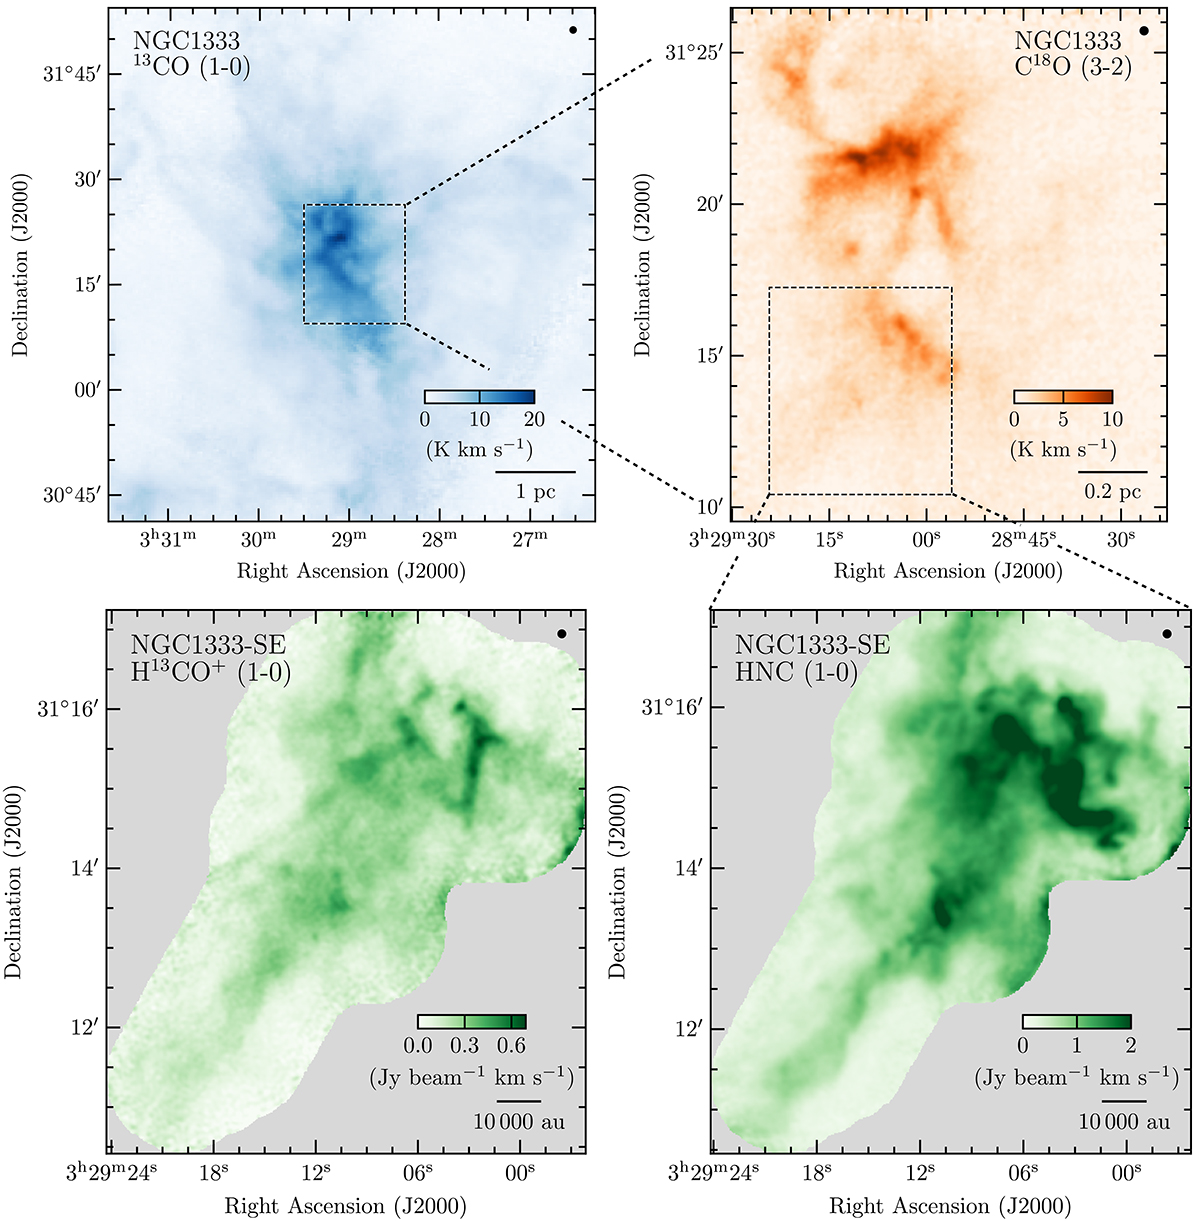
Fig. 1.
Download original image
Integrated intensity map of the different tracers used to observe the NGC1333 region. Top left: Large scale traced with 13CO (1–0). The footprint of the C18O (3–2) map is marked by the dashed box. Top right: Intermediate scale traced with C18O (3–2). The footprint of the interferometric data is marked by the dashed box. Bottom left and right: Highest angular resolution maps of H13CO+ and HNC (1–0), respectively. The beam size and scale bar are shown in the top right and bottom right corners, respectively.
Current usage metrics show cumulative count of Article Views (full-text article views including HTML views, PDF and ePub downloads, according to the available data) and Abstracts Views on Vision4Press platform.
Data correspond to usage on the plateform after 2015. The current usage metrics is available 48-96 hours after online publication and is updated daily on week days.
Initial download of the metrics may take a while.