Fig. 6
Download original image
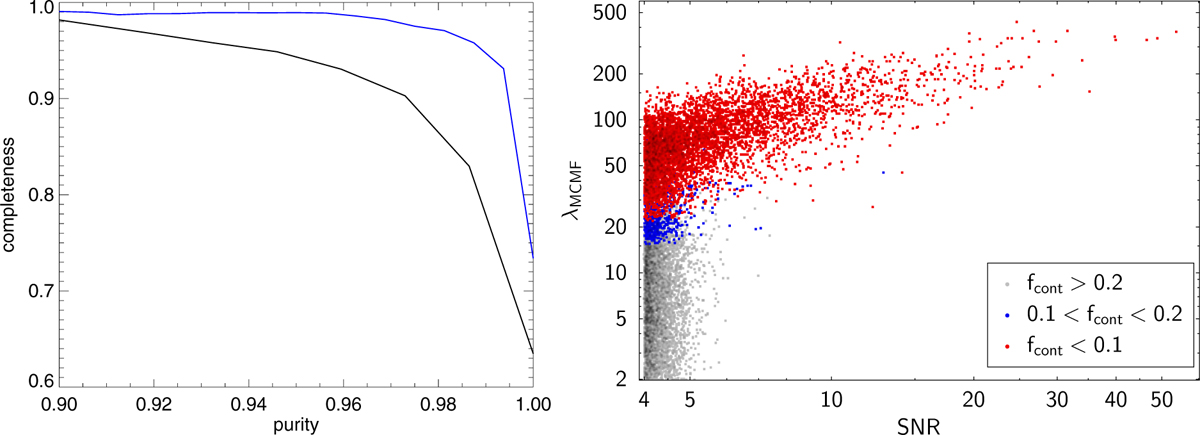
Defining the cluster catalog. Left: completeness with respect to the initial tSZE selection versus purity after optical cleaning with fcont (![]() increasing from left to right) for candidate lists imposing SNR>4 (black) and SNR>4.5 (blue). Right: distribution of ACT-DR5 candidates in richness vs. SNR, color coded according to the fcont ranges.
increasing from left to right) for candidate lists imposing SNR>4 (black) and SNR>4.5 (blue). Right: distribution of ACT-DR5 candidates in richness vs. SNR, color coded according to the fcont ranges.
Current usage metrics show cumulative count of Article Views (full-text article views including HTML views, PDF and ePub downloads, according to the available data) and Abstracts Views on Vision4Press platform.
Data correspond to usage on the plateform after 2015. The current usage metrics is available 48-96 hours after online publication and is updated daily on week days.
Initial download of the metrics may take a while.