Open Access
Fig. 4
Download original image
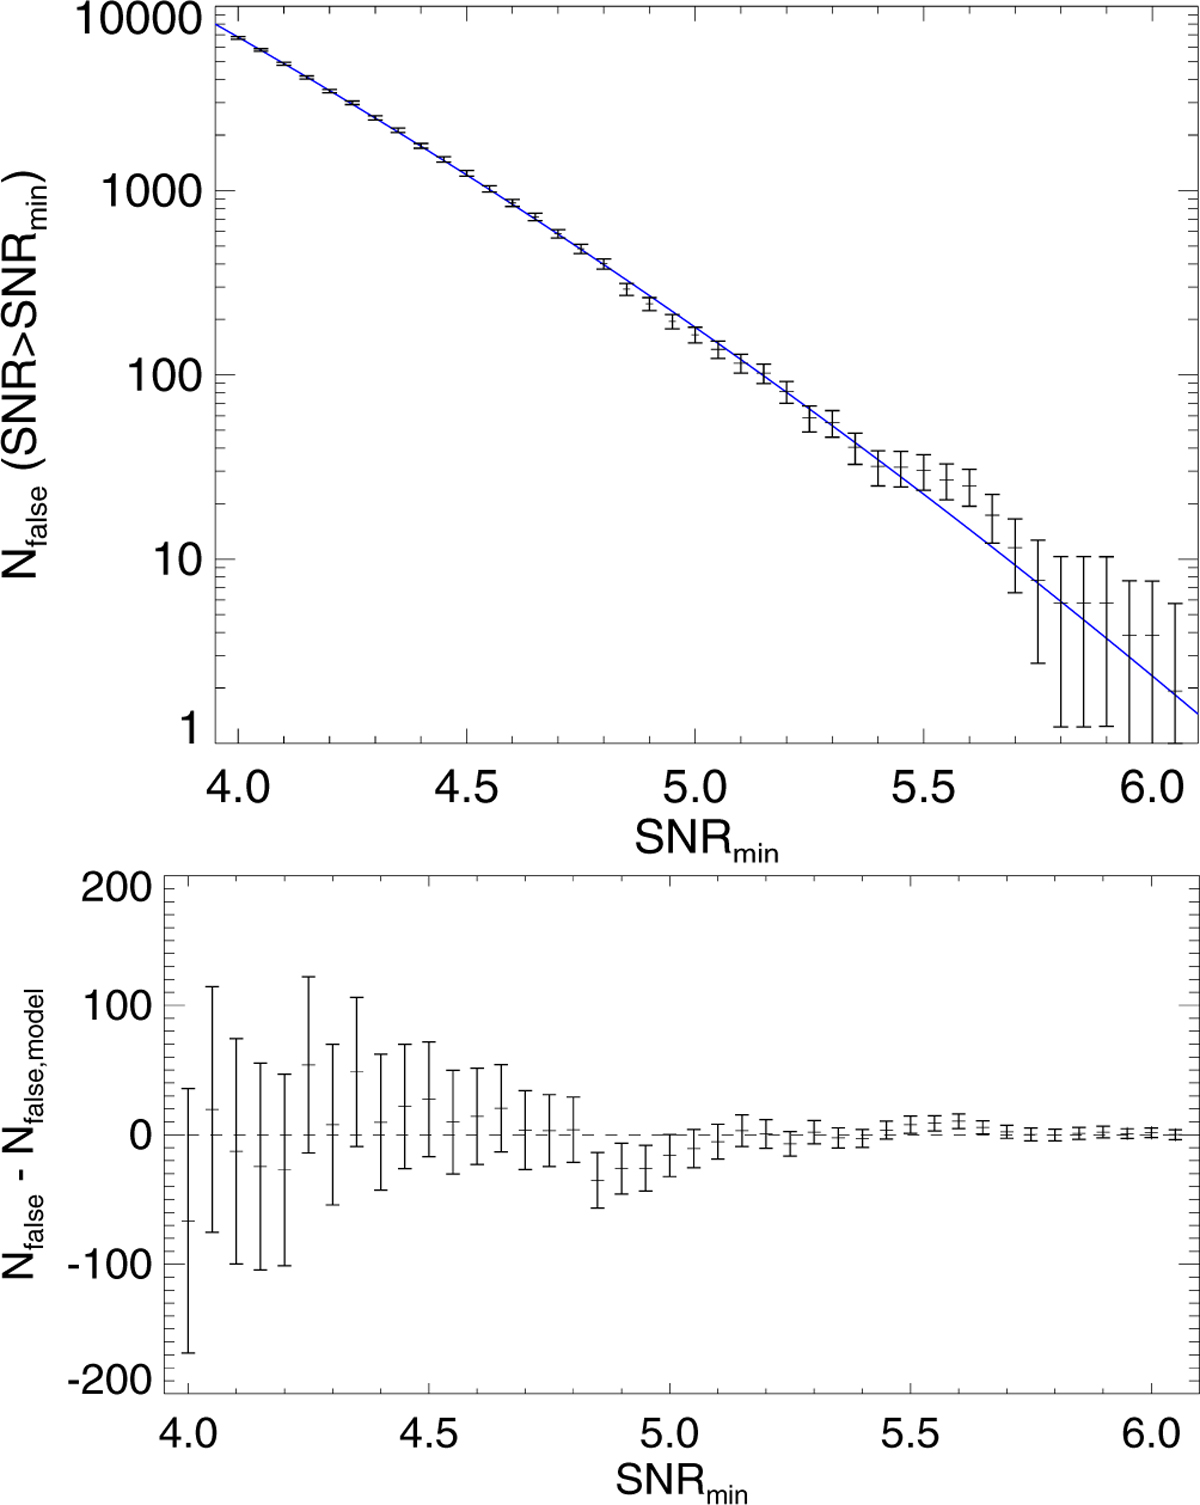
Measured cumulative number of false detections from noise fluctuations in the millimeter-wave maps as a function of the tSZE SNR threshold. The blue line shows the best fit Gaussian noise model. The two parameter fit describes the data over full regime explored, corresponding to almost four orders of magnitude.
Current usage metrics show cumulative count of Article Views (full-text article views including HTML views, PDF and ePub downloads, according to the available data) and Abstracts Views on Vision4Press platform.
Data correspond to usage on the plateform after 2015. The current usage metrics is available 48-96 hours after online publication and is updated daily on week days.
Initial download of the metrics may take a while.