Fig. 11
Download original image
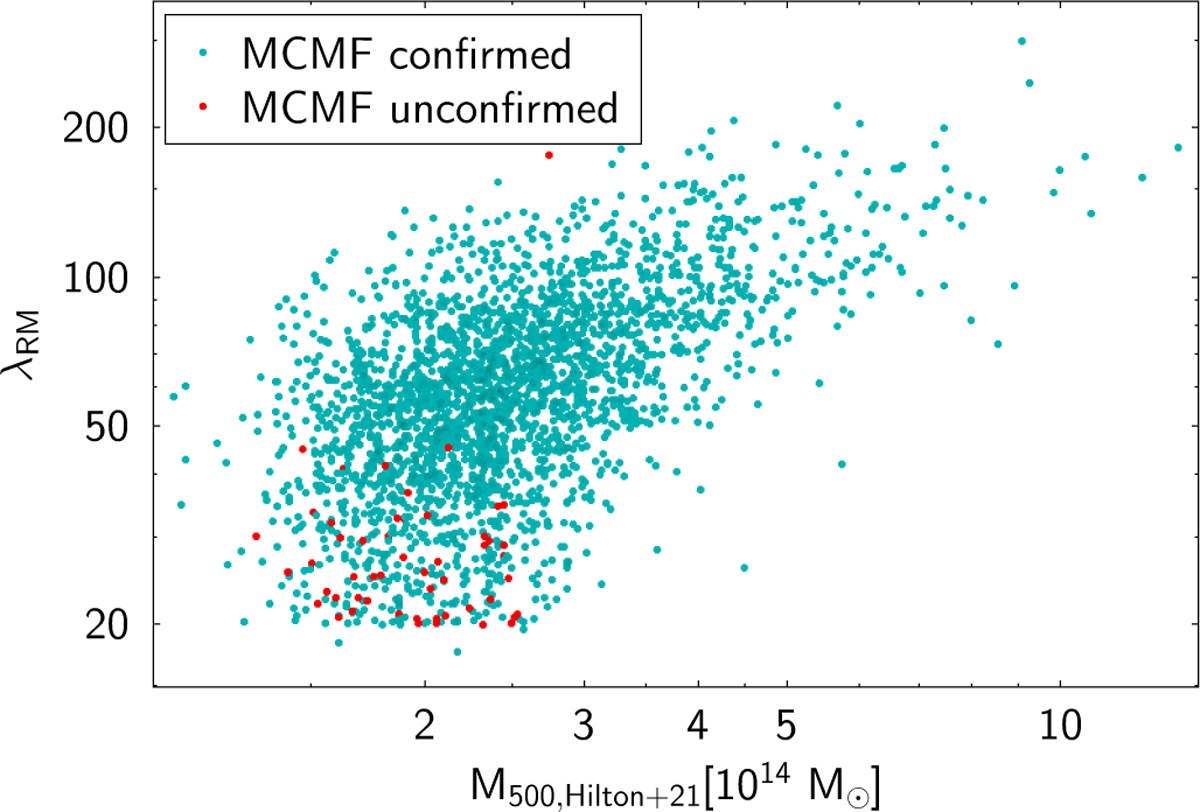
Richness versus tSZE mass of clusters from the previous ACT-DR5 catalog (Hilton et al. 2021). Richness is either from DES or SDSS redMaPPer (Rykoff et al. 2016) or CAMIRA (Oguri et al. 2018) and scaled to account for systematic uncertainties between redMaPPer and CAMIRA. Clusters also confirmed by MCMF are shown in blue, while those not confirmed with MCMF (red points) show up largely at low richness and tSZE-based mass.
Current usage metrics show cumulative count of Article Views (full-text article views including HTML views, PDF and ePub downloads, according to the available data) and Abstracts Views on Vision4Press platform.
Data correspond to usage on the plateform after 2015. The current usage metrics is available 48-96 hours after online publication and is updated daily on week days.
Initial download of the metrics may take a while.