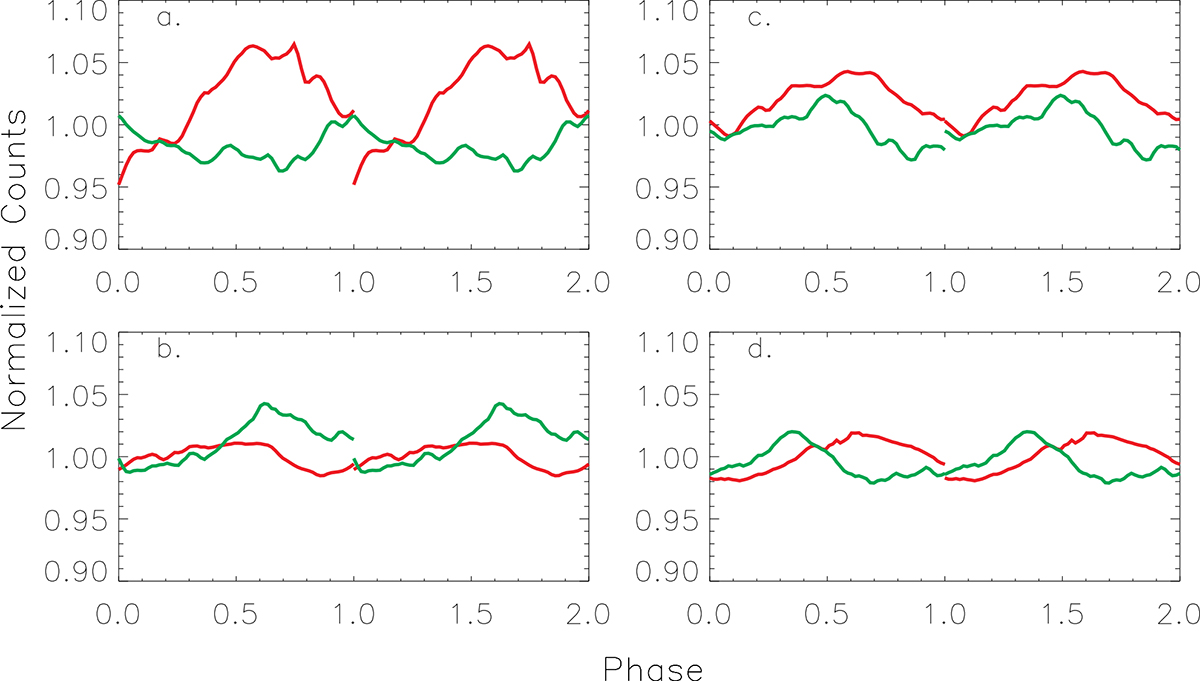
Fig. 3.
Download original image
Sample folded light curves comparing the G-band and Hα as a phase function, each light curve is folded on its respective periods. The MBPs for the G-band positions are shown as: a. 459, 632 (MBP #5); b. 670, 640 (MBP #13); c. 708, 846 (MBP #17); and d. 770, 642 (MBP #21). Signals for panel a show a strong anti-correlation. Signals from panel c show a strong correlation, while panels b and c show weaker positive correlations (see the main text).
Current usage metrics show cumulative count of Article Views (full-text article views including HTML views, PDF and ePub downloads, according to the available data) and Abstracts Views on Vision4Press platform.
Data correspond to usage on the plateform after 2015. The current usage metrics is available 48-96 hours after online publication and is updated daily on week days.
Initial download of the metrics may take a while.