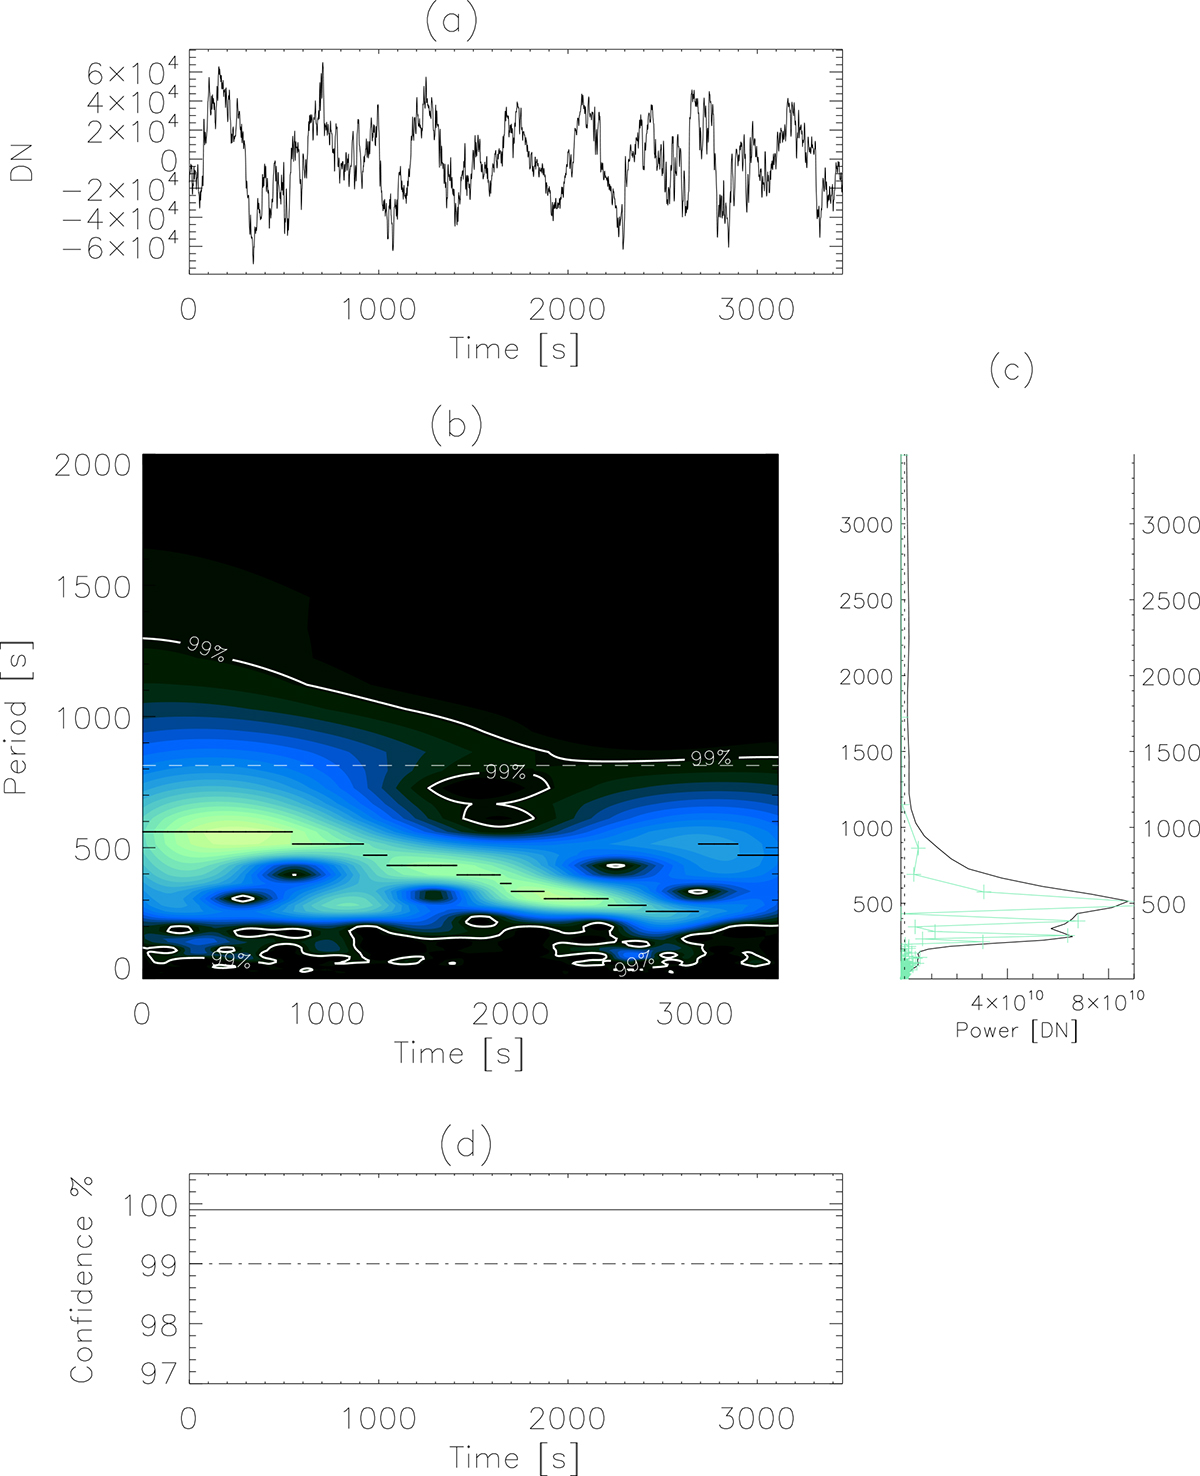
Fig. 2.
Download original image
Temporal analysis of a sample G-band light curve. (a) An MBP’s de-trended G-band light curve at 541, 411 (MBP #10; see Table 1). (b) Wavelet power transform along with locations at which detected power is at or above the 99% confidence level contained within the contours. (c) Summation of the wavelet power transform over time (full line) and the fast Fourier power spectrum (crosses) over time, plotted as a function of period. Both methods show strong detection near 540 seconds. (d) Global wavelet (solid line) and Fourier (dashed-dotted line) 99% significance levels.
Current usage metrics show cumulative count of Article Views (full-text article views including HTML views, PDF and ePub downloads, according to the available data) and Abstracts Views on Vision4Press platform.
Data correspond to usage on the plateform after 2015. The current usage metrics is available 48-96 hours after online publication and is updated daily on week days.
Initial download of the metrics may take a while.