Open Access
Fig. 1.
Download original image
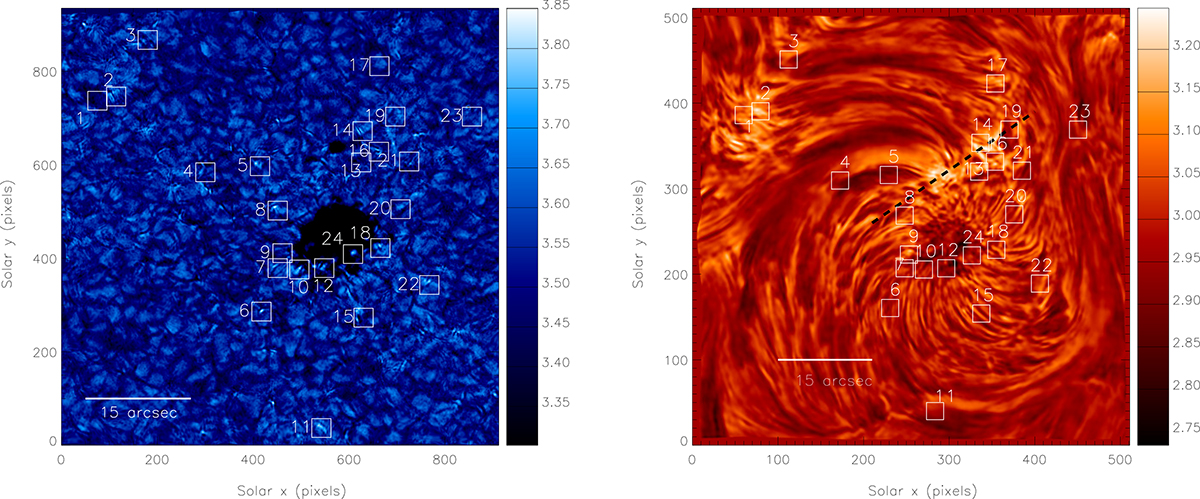
From left to right: Reconstructed ROSA images for the G-band and Hα of active region NOAA AR11249. The overlying boxes show the corresponding MBPs. The dashed black line in the Hα images (just above the AR) indicates the region used for the time-distance plot shown in Fig. 4.
Current usage metrics show cumulative count of Article Views (full-text article views including HTML views, PDF and ePub downloads, according to the available data) and Abstracts Views on Vision4Press platform.
Data correspond to usage on the plateform after 2015. The current usage metrics is available 48-96 hours after online publication and is updated daily on week days.
Initial download of the metrics may take a while.