Fig. 4
Download original image
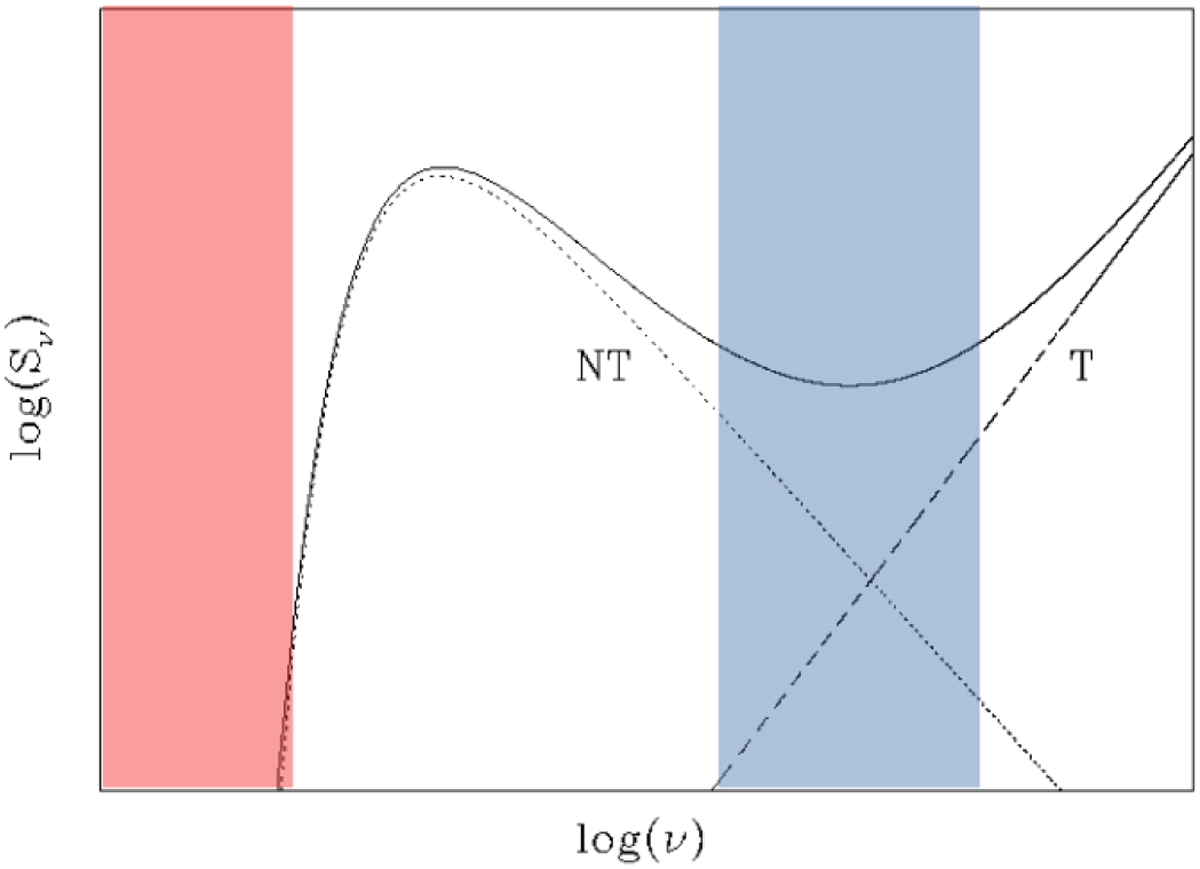
Schematic view of the radio composite spectrum (solid curve) of a PACWB presenting both a thermal component (T, dashed line) and a turned-over synchrotron component (NT, dotted curve). The blue highlighted part covers a spectral region with an almost flat spectrum, while the red part covers the region where NT emission is suppressed.
Current usage metrics show cumulative count of Article Views (full-text article views including HTML views, PDF and ePub downloads, according to the available data) and Abstracts Views on Vision4Press platform.
Data correspond to usage on the plateform after 2015. The current usage metrics is available 48-96 hours after online publication and is updated daily on week days.
Initial download of the metrics may take a while.