Fig. 6.
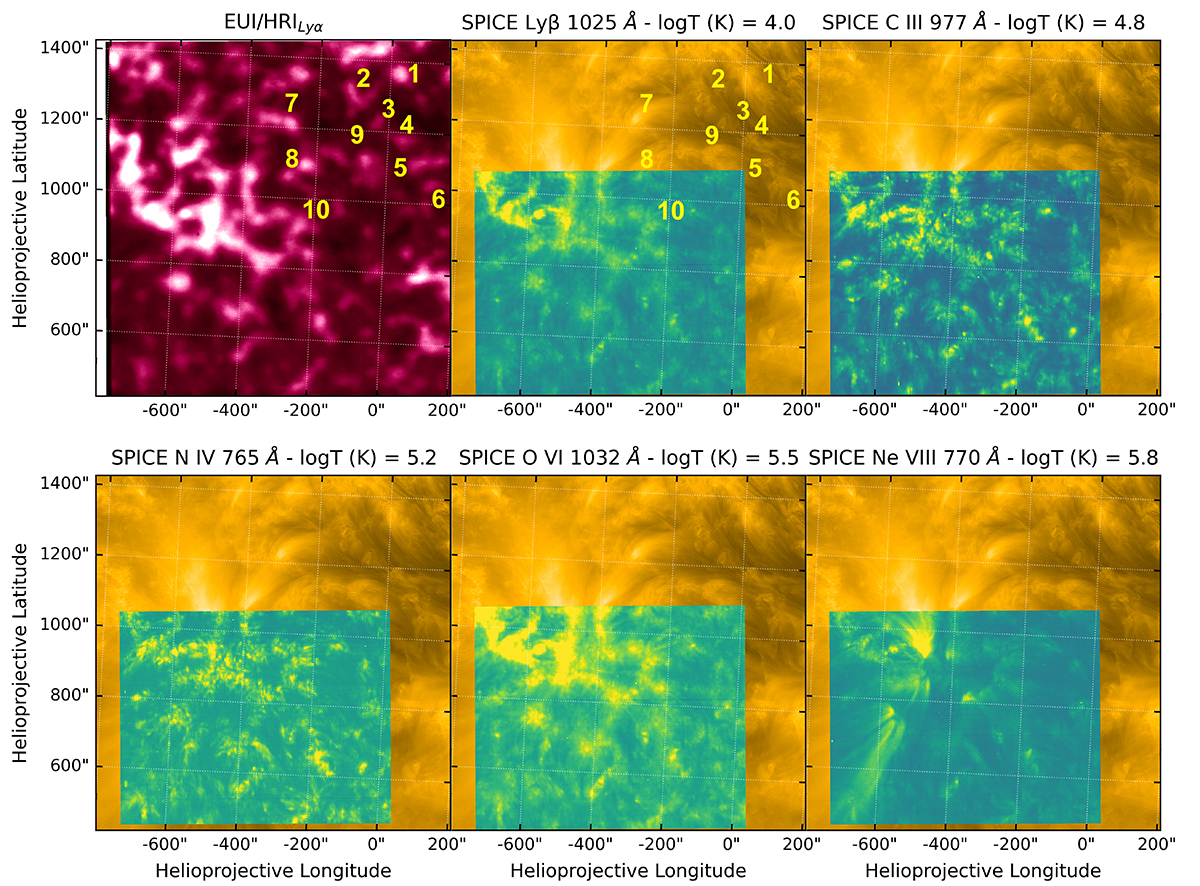
Download original image
Co-aligned HRILyα image and SPICE integrated intensities showing the chromospheric/TR view of NOAA 12967 and the DH fine structure. The SPICE observations in the H-Lyβ, C III, N IV, O VI, and Ne VIII lines (ordered as function of temperature) are overplotted on the HRIEUV image. The numbers in the top-left and middle panels mark the locations of the EUV bundles shown in Fig. 3 that have a clear counterpart in the HRILyα image. The bundle marked by number 10 also has counterparts observed in the SPICE rasters.
Current usage metrics show cumulative count of Article Views (full-text article views including HTML views, PDF and ePub downloads, according to the available data) and Abstracts Views on Vision4Press platform.
Data correspond to usage on the plateform after 2015. The current usage metrics is available 48-96 hours after online publication and is updated daily on week days.
Initial download of the metrics may take a while.