Fig. 4.
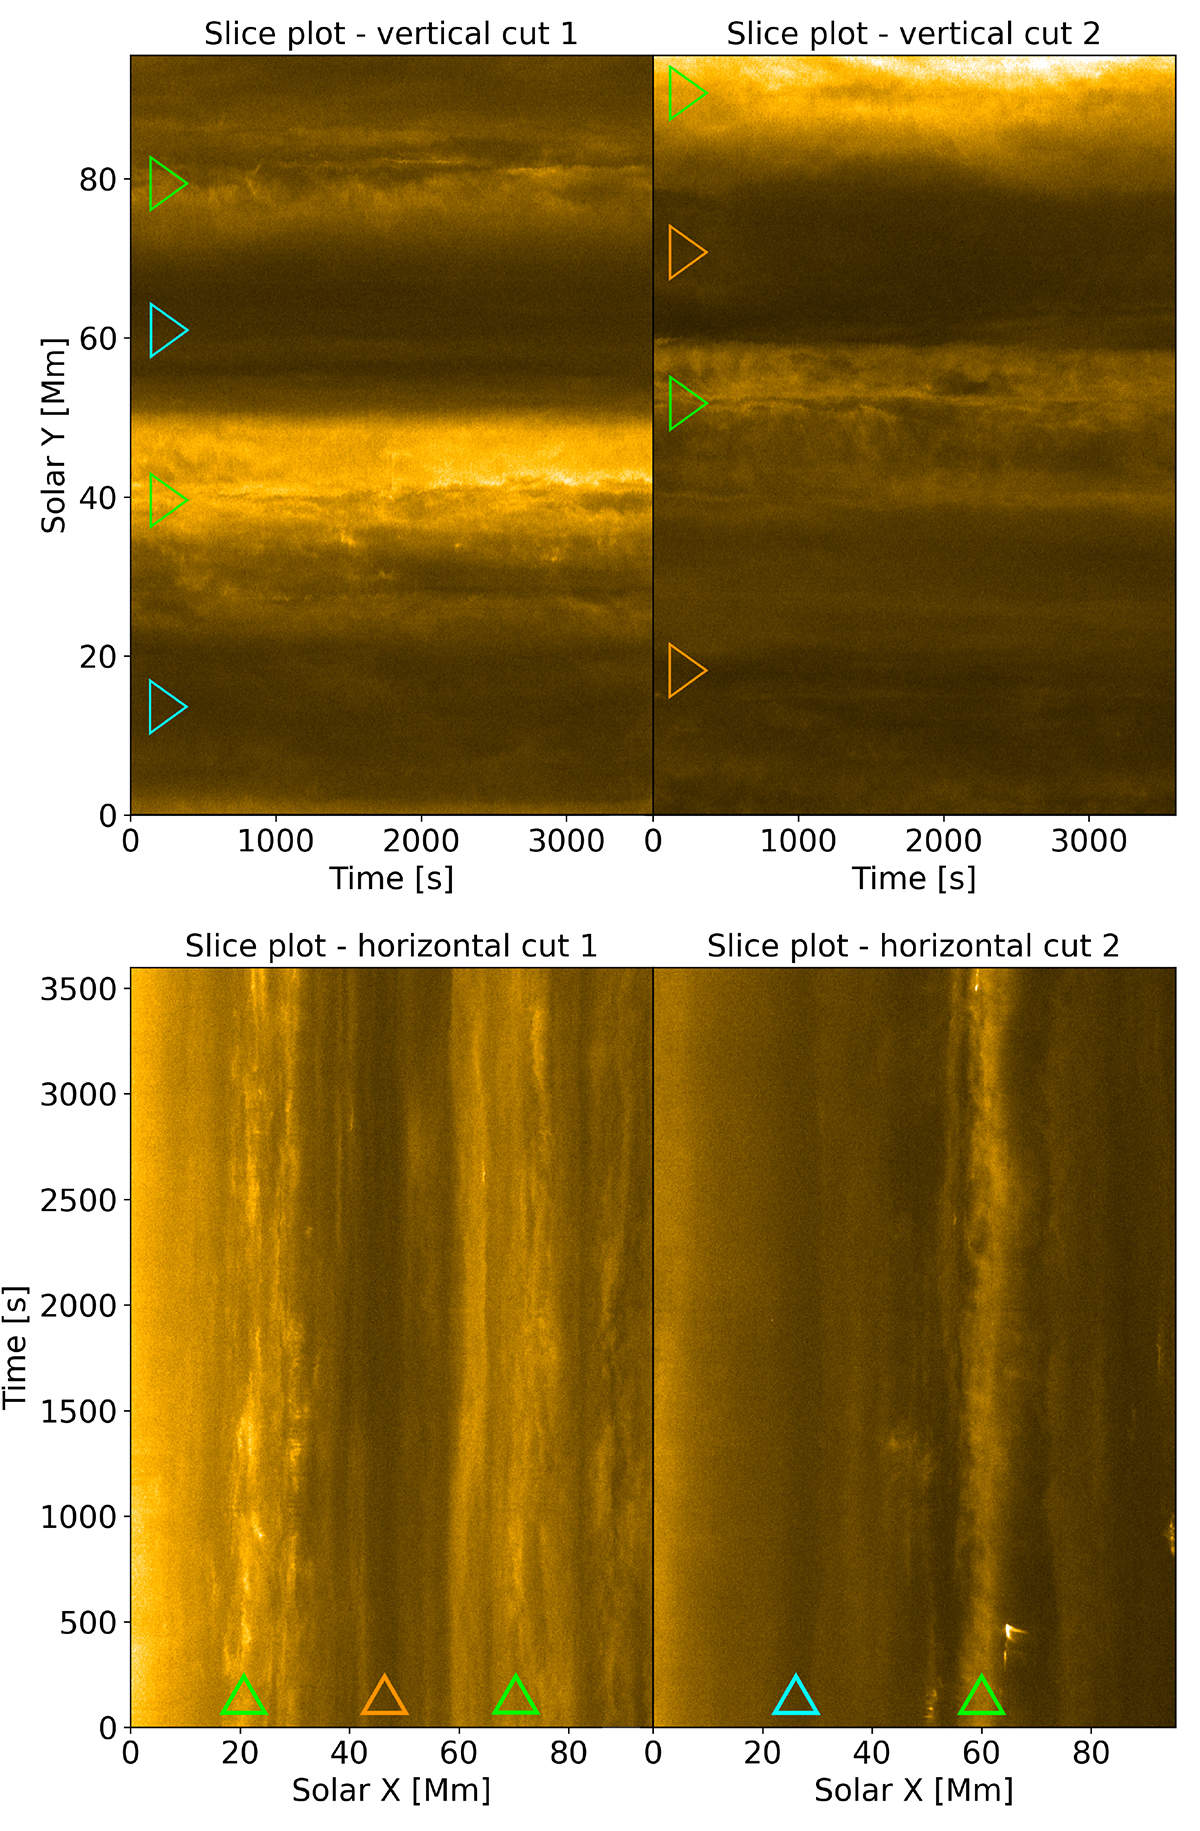
Download original image
HRIEUV slice plots of the vertical (top) and horizontal (bottom) slices shown in Figs. 2 and 3. The green triangles are located on the bulk of bright EUV bundles; the orange triangles are located on dark regions that can be traced back to EUV bundles in the HRIEUV image; the cyan triangle is located on the bulk of a dark region that cannot be traced back to any EUV bundle in the HRIEUV image.
Current usage metrics show cumulative count of Article Views (full-text article views including HTML views, PDF and ePub downloads, according to the available data) and Abstracts Views on Vision4Press platform.
Data correspond to usage on the plateform after 2015. The current usage metrics is available 48-96 hours after online publication and is updated daily on week days.
Initial download of the metrics may take a while.