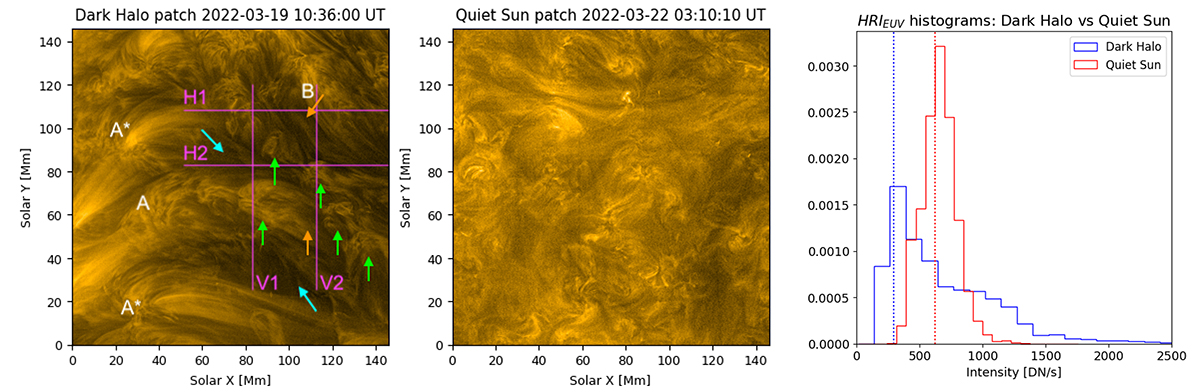
Fig. 3.
Download original image
HRIEUV close-up view of the DH fine structure taken from Fig. 2 and quiet Sun patch of the same size taken on March 22, 2022, shown in the left and middle panels. The size of both patches is 146 × 146 Mm. The images are enhanced with the Multi-scale Gaussian normalization algorithm (Morgan & Druckmüller 2014). The ‘A’ mark labels a regular EUV bundle observed in the DH fine structure; the ‘A*’ mark labels a comet-like EUV bundle observed in the DH fine structure. The green arrows point at some examples of dome-like bundles; the orange arrow points at the darker filamentary body associated with the dome located at (80,65) Mm. The cyan arrows point to the dark areas that cannot be easily traced back to any bundle. The magenta horizontal (H1 and H2) and vertical (V1 and V2) lines are the slices chosen to build the slice plots shown in Fig. 4. See Section 3 for more information. Right panel shows the normalized histograms of the DH fine structure and quiet Sun patches shown here. The red and blue dotted lines represent the mode of the QS and DH distributions, respectively.
Current usage metrics show cumulative count of Article Views (full-text article views including HTML views, PDF and ePub downloads, according to the available data) and Abstracts Views on Vision4Press platform.
Data correspond to usage on the plateform after 2015. The current usage metrics is available 48-96 hours after online publication and is updated daily on week days.
Initial download of the metrics may take a while.