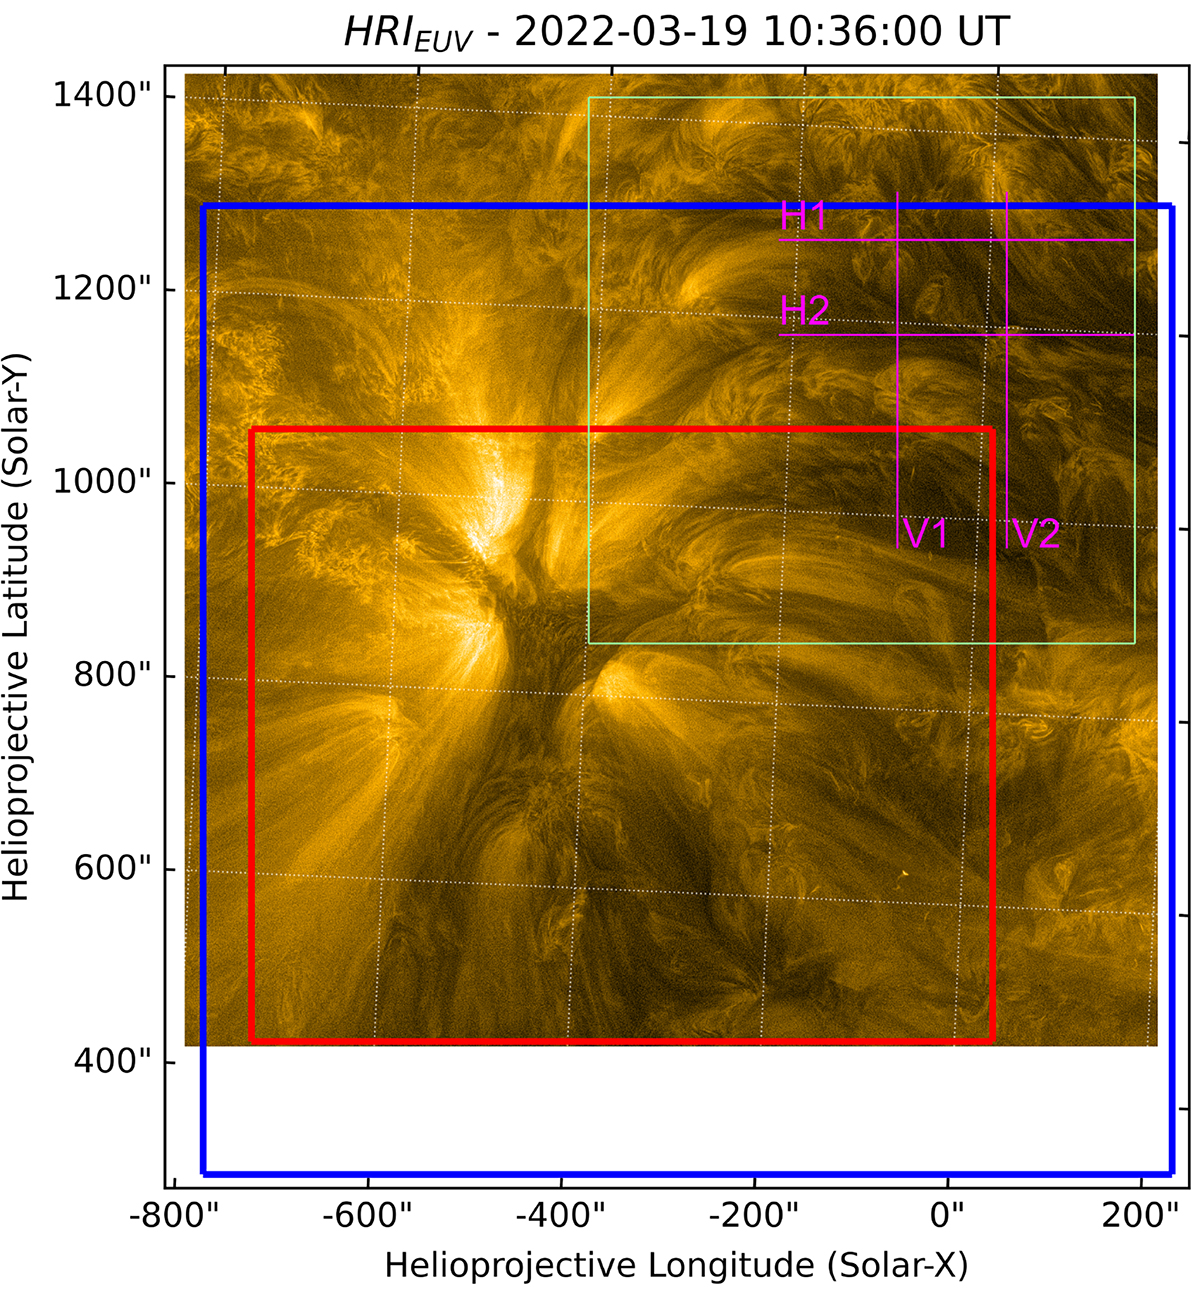
Fig. 2.
Download original image
EUI/HRIEUV snapshot taken on March 19, 2022 at 10:36:09 UT. The red box is the FoV of the SPICE co-aligned image taken at 10:37:00 UT; the blue box is the FoV of the HRT co-aligned image taken at 10:36:09 UT. The green box represents the close-up view of DH fine structure shown in Fig. 3. The magenta horizontal (H1 and H2) and vertical (V1 and V2) lines are the slices chosen to build the slice plots shown in Fig. 4. The image is enhanced with the multiscale Gaussian normalization algorithm (Morgan & Druckmüller 2014).
Current usage metrics show cumulative count of Article Views (full-text article views including HTML views, PDF and ePub downloads, according to the available data) and Abstracts Views on Vision4Press platform.
Data correspond to usage on the plateform after 2015. The current usage metrics is available 48-96 hours after online publication and is updated daily on week days.
Initial download of the metrics may take a while.