Fig. 7.
Download original image
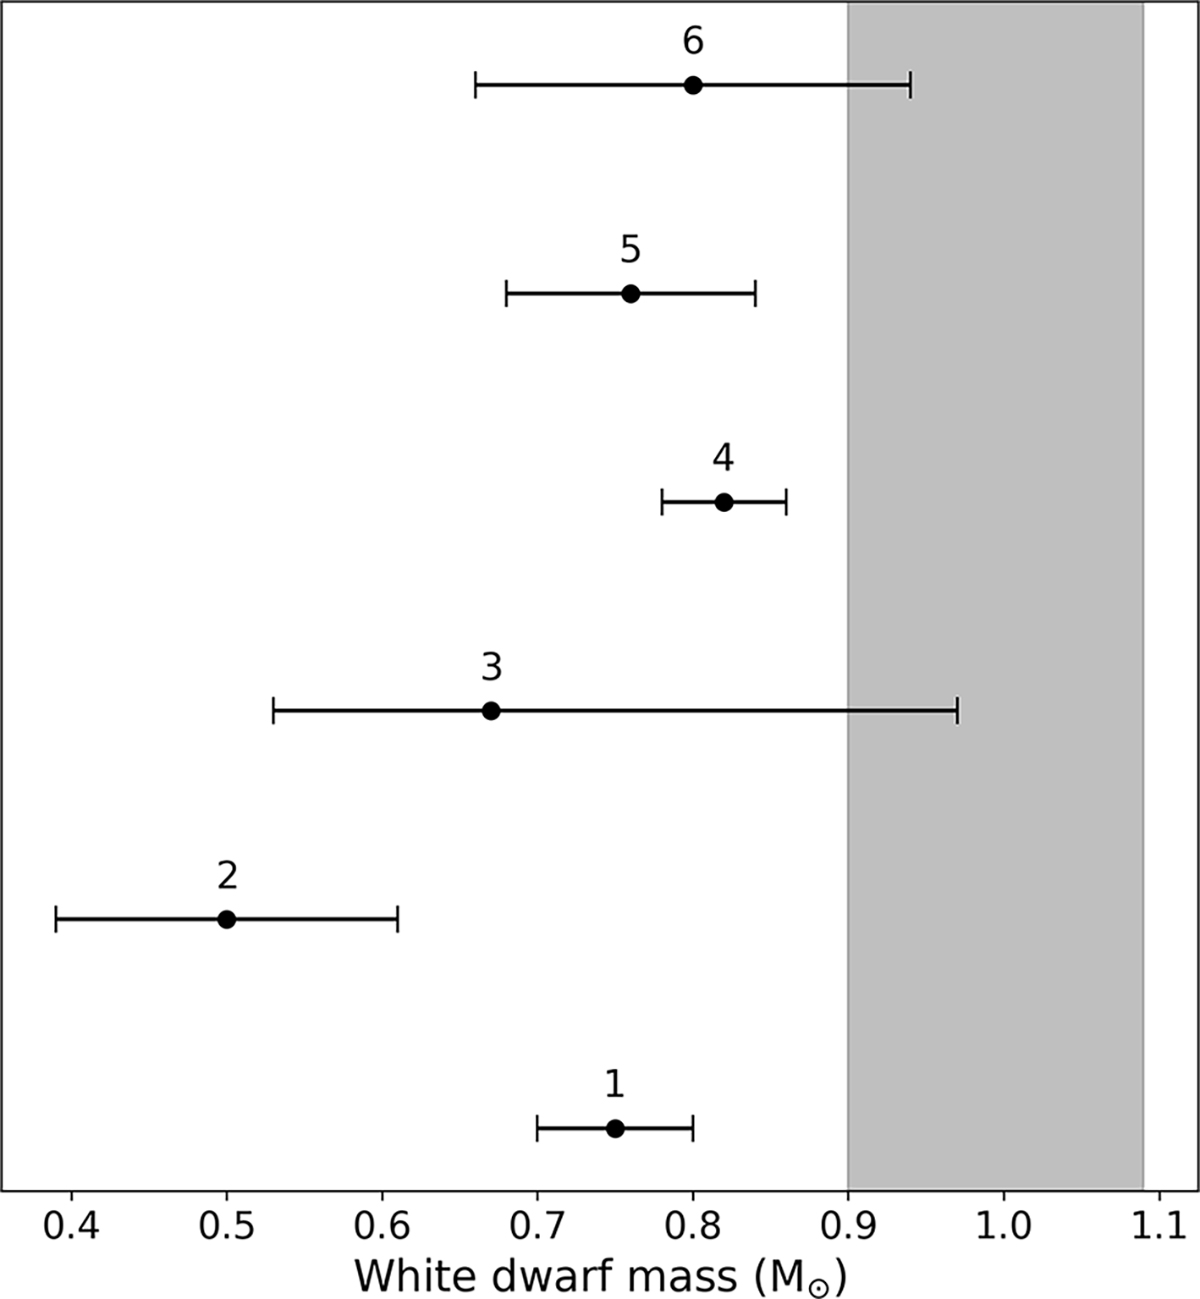
Visual comparison of our dynamical WD mass for YY Dra (shaded column, 1 σ) with previous estimates derived from spectral modelling of: RXTE hard X-ray data (labelled in the figure as 1; Suleimanov et al. 2005), Swift hard X-ray data (labelled as 2 and 5; Brunschweiger et al. 2009 and Suleimanov et al. 2019) and Suzaku hard X-ray data (labelled as 3 and 4; Yuasa et al. 2010 and Xu et al. 2019). We also include one estimate based on the ratio of the iron emission lines in Suzaku spectroscopy (labelled as 6; Xu et al. 2019).
Current usage metrics show cumulative count of Article Views (full-text article views including HTML views, PDF and ePub downloads, according to the available data) and Abstracts Views on Vision4Press platform.
Data correspond to usage on the plateform after 2015. The current usage metrics is available 48-96 hours after online publication and is updated daily on week days.
Initial download of the metrics may take a while.