Fig. 5.
Download original image
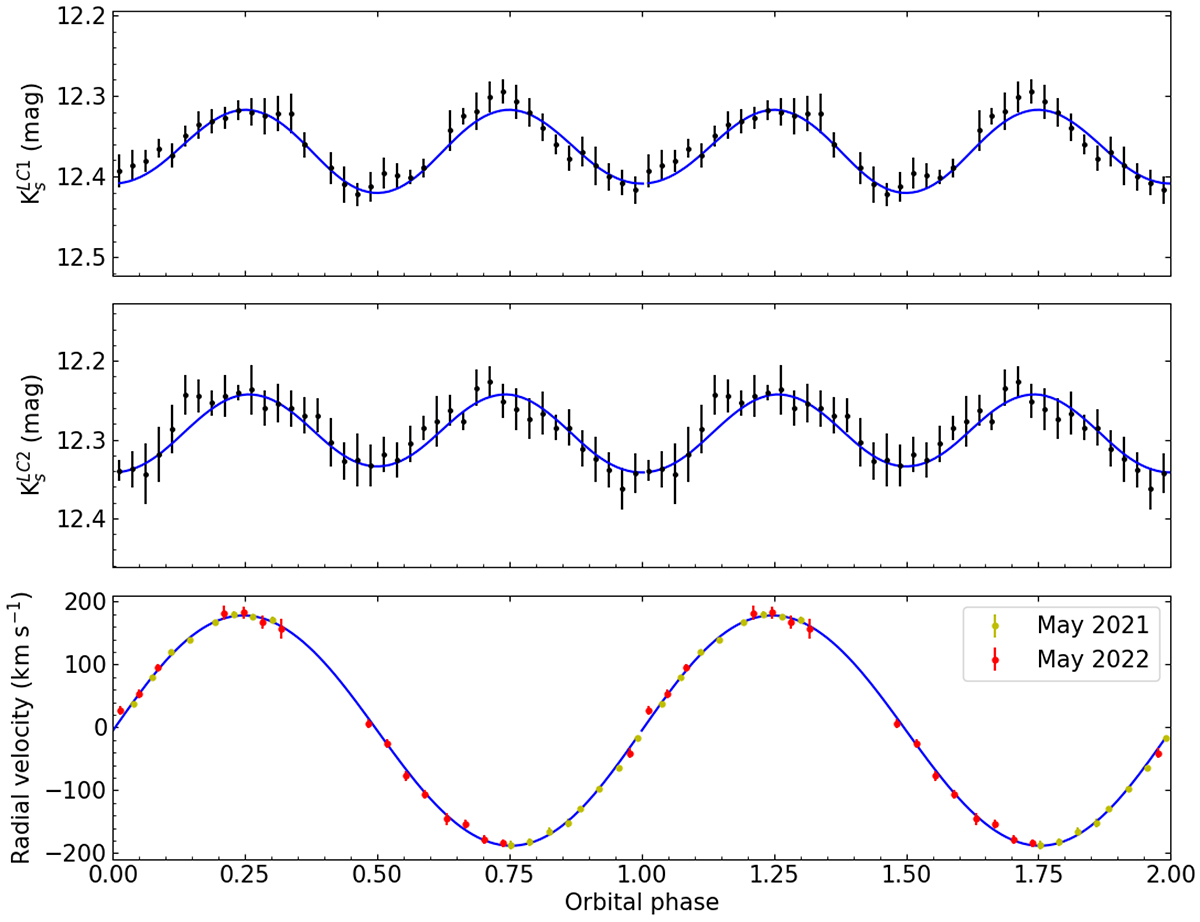
Result of the simultaneous modelling of the light and radial velocity curves of YY Dra. From top to bottom: phase-binned Ks-band light curves from 2021 March 31 and May 5, followed by the radial velocity curve of the donor star (excluding the 2020 February data). The blue solid lines represent the best fit. The orbital cycle is shown twice for the sake of clarity. The fit of the first light curve (top panel) displays the absolute minimum at orbital phase 0.5, while it is at phase 0 in the fit of the second curve (middle panel) due to changes in irradiation (![]() , Table 6).
, Table 6).
Current usage metrics show cumulative count of Article Views (full-text article views including HTML views, PDF and ePub downloads, according to the available data) and Abstracts Views on Vision4Press platform.
Data correspond to usage on the plateform after 2015. The current usage metrics is available 48-96 hours after online publication and is updated daily on week days.
Initial download of the metrics may take a while.