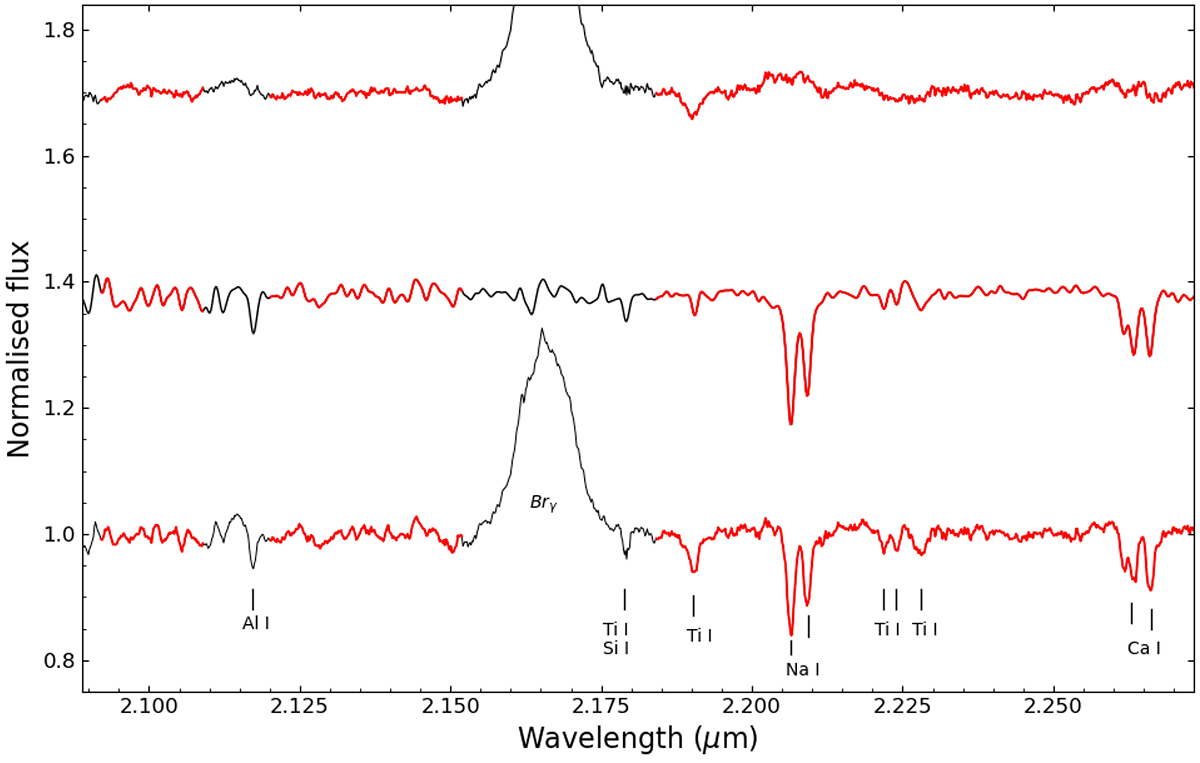
Fig. 3.
Download original image
Example of the application of the optimal subtraction technique. The order of the spectra, from bottom to top, is as follows: YY Dra average in the apparent rest frame of the donor star, Gl 402 template from Rojas-Ayala et al. (2012) broadened to match the YY Dra average, and the residual after subtraction of the broadened and scaled template. Red sections in the spectra indicate the wavelength regions used for the analysis. For clarity, the template and residual spectra have been vertically shifted. We mark the most important absorption lines according to the NASA IRTF spectral library atlas (Rayner et al. 2009). Optimal subtraction removes all lines of the donor star, except for the Ti I line at 2.1903 μm. This is also true for the other templates and in Harrison (2016), indicating that this difference is intrinsic to YY Dra.
Current usage metrics show cumulative count of Article Views (full-text article views including HTML views, PDF and ePub downloads, according to the available data) and Abstracts Views on Vision4Press platform.
Data correspond to usage on the plateform after 2015. The current usage metrics is available 48-96 hours after online publication and is updated daily on week days.
Initial download of the metrics may take a while.