Fig. 9
Download original image
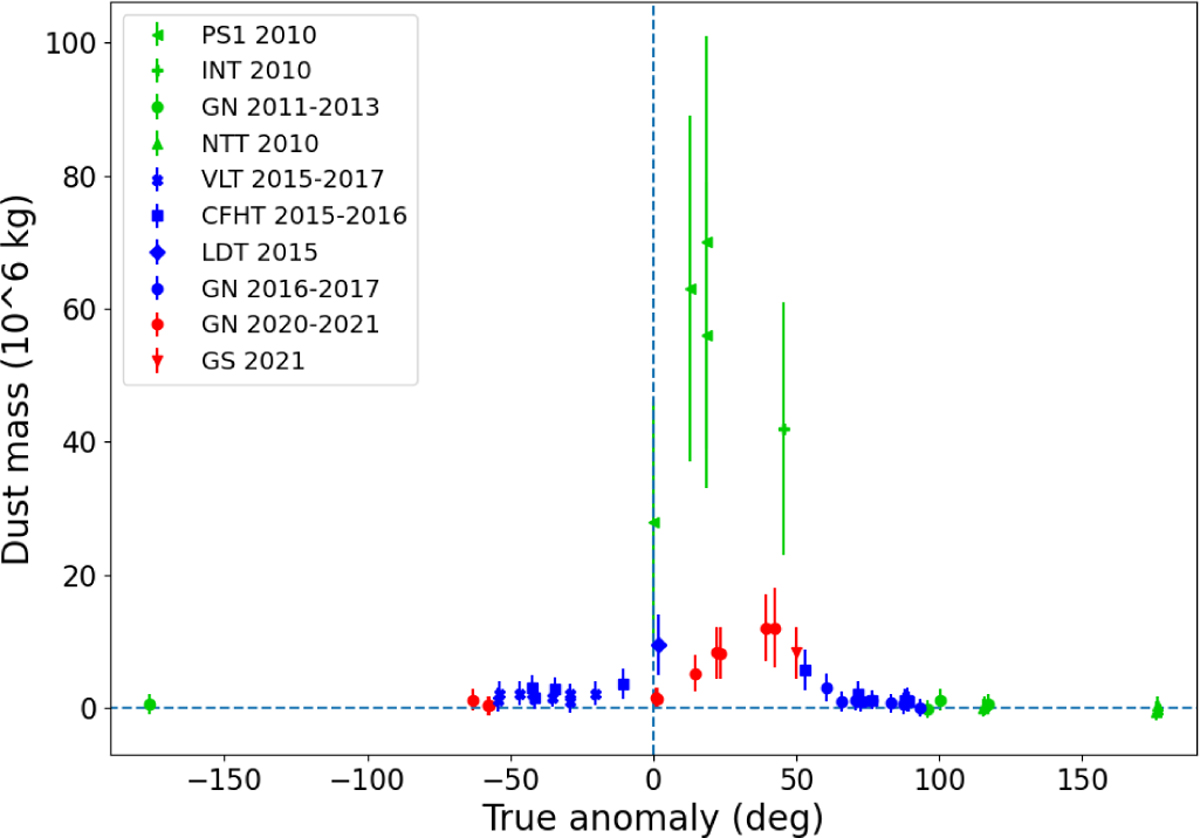
Estimated dust masses for 324P plotted as a function of the true anomaly. The different symbols correspond to the different telescopes and instruments used, and the different colors correspond to the three different perihelion passages: green for 2010, blue for 2015, and red for 2021. The horizontal dashed line corresponds to a zero dust mass (the MBC was not active).
Current usage metrics show cumulative count of Article Views (full-text article views including HTML views, PDF and ePub downloads, according to the available data) and Abstracts Views on Vision4Press platform.
Data correspond to usage on the plateform after 2015. The current usage metrics is available 48-96 hours after online publication and is updated daily on week days.
Initial download of the metrics may take a while.