Fig. 12
Download original image
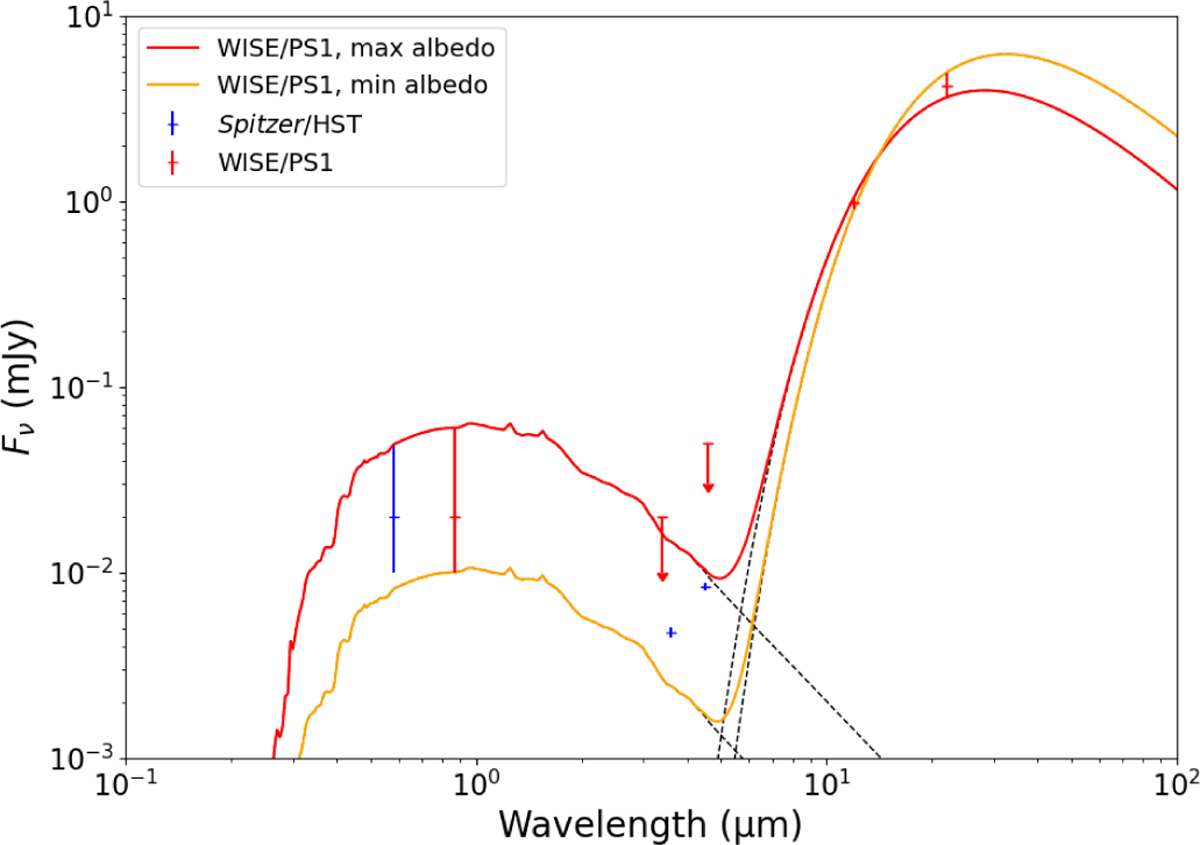
SEDs corresponding to the maximum (red) and minimum (yellow) derived geometric albedo values from the WISE/PS1 combination. The Spitzer/HST data are also plotted (blue). Even though taken during different perihelion passages and from different observer distances, we plot the measurements and resulting fits in a single graph. The dashed lines indicate the pure blackbody and solar spectra composing the overall SED.
Current usage metrics show cumulative count of Article Views (full-text article views including HTML views, PDF and ePub downloads, according to the available data) and Abstracts Views on Vision4Press platform.
Data correspond to usage on the plateform after 2015. The current usage metrics is available 48-96 hours after online publication and is updated daily on week days.
Initial download of the metrics may take a while.