Fig. 6
Download original image
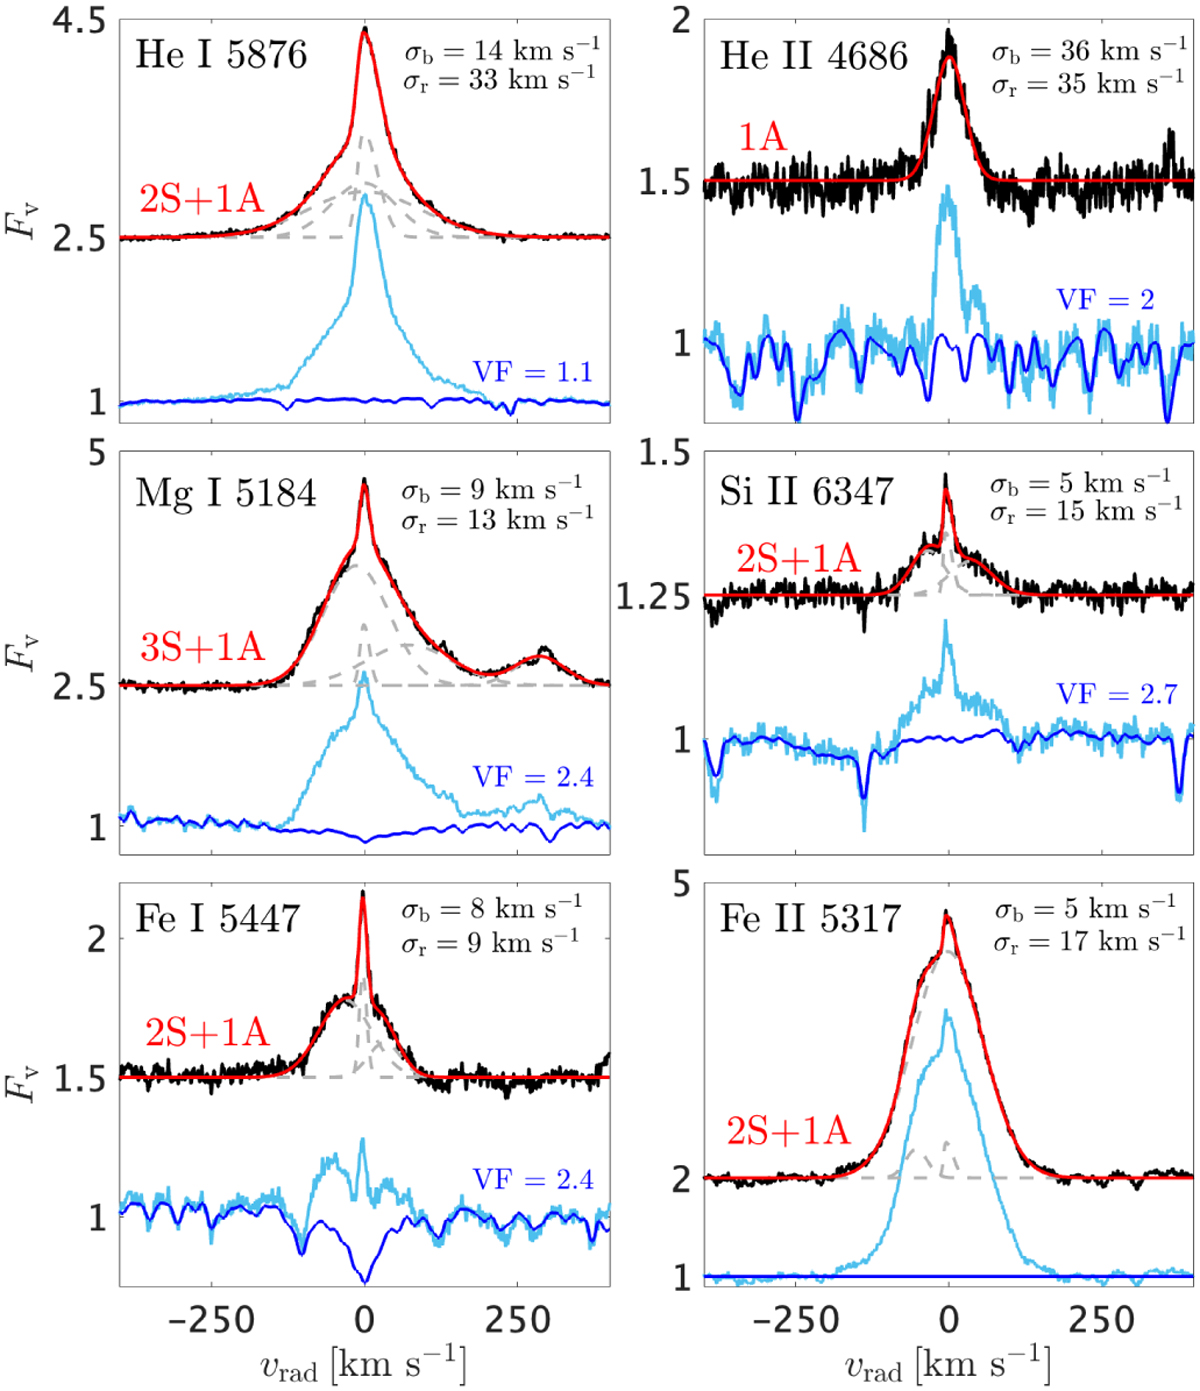
Selection of emission lines that have a NC. The light blue spectrum is ES 22.5. The dark blue spectra are the template that best fits the stellar spectrum (Sec. 3), veiled to match the depth of the photo-spheric lines. The photospheric subtracted spectra are shown in black, with Gaussian best fits superposed in red. The red label specifies the multiple Gaussian model used (Appendix B).
Current usage metrics show cumulative count of Article Views (full-text article views including HTML views, PDF and ePub downloads, according to the available data) and Abstracts Views on Vision4Press platform.
Data correspond to usage on the plateform after 2015. The current usage metrics is available 48-96 hours after online publication and is updated daily on week days.
Initial download of the metrics may take a while.