Fig. C.1
Download original image
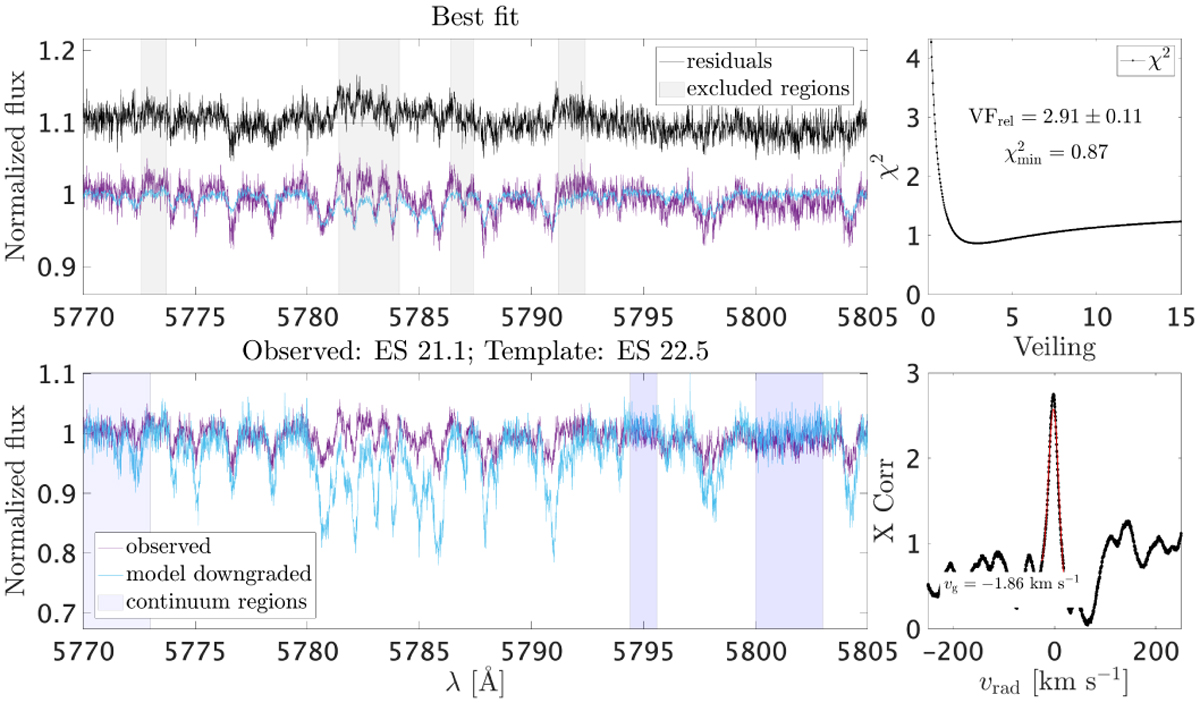
Veiling calculation for the ES 21.1 spectrum. The bottom left panel shows the ES 21.1 and ES 22.5 spectra, normalized used the shaded regions. The top left panel shows the veiled ES 22.5 spectrum that best fits the ES 21.1 spectrum. The right panels display the cross correlation function (bottom) and the χ2 as a function of VF (top).
Current usage metrics show cumulative count of Article Views (full-text article views including HTML views, PDF and ePub downloads, according to the available data) and Abstracts Views on Vision4Press platform.
Data correspond to usage on the plateform after 2015. The current usage metrics is available 48-96 hours after online publication and is updated daily on week days.
Initial download of the metrics may take a while.