Open Access
Fig. 2
Download original image
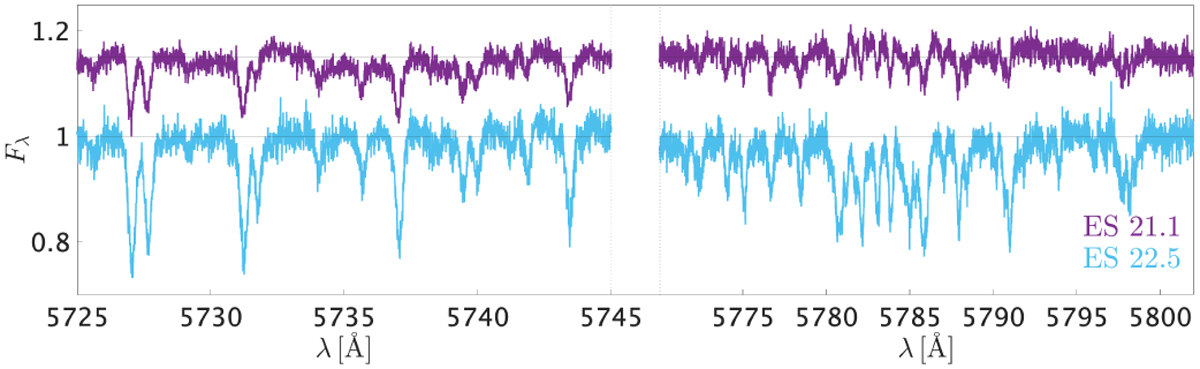
ES 21.1 and ES 22.5 spectra in two regions where the photospheric absorption lines are observed. The region between 5770 and 5805 Å shows the effect of line-filling emission.
Current usage metrics show cumulative count of Article Views (full-text article views including HTML views, PDF and ePub downloads, according to the available data) and Abstracts Views on Vision4Press platform.
Data correspond to usage on the plateform after 2015. The current usage metrics is available 48-96 hours after online publication and is updated daily on week days.
Initial download of the metrics may take a while.