Fig. 15
Download original image
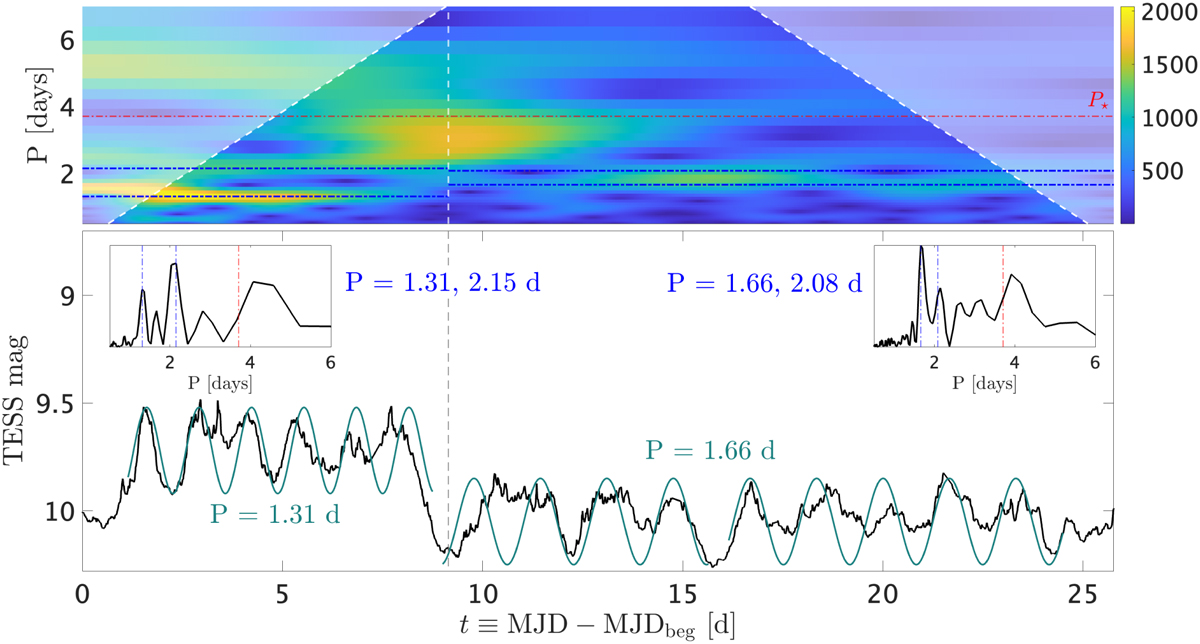
Continuous wavelet analysis of the TESS Sector 65 light curve. The top panel shows the CWT. The bottom panel displays the light curve. The insets show the LSP for the two portions of the light curve. The blue and red lines mark the detected period and P*, respectively. Sinusoidal oscillations are superposed to the TESS observation in green, with the period of the oscillations in each portion reported with the same color.
Current usage metrics show cumulative count of Article Views (full-text article views including HTML views, PDF and ePub downloads, according to the available data) and Abstracts Views on Vision4Press platform.
Data correspond to usage on the plateform after 2015. The current usage metrics is available 48-96 hours after online publication and is updated daily on week days.
Initial download of the metrics may take a while.