Fig. 14
Download original image
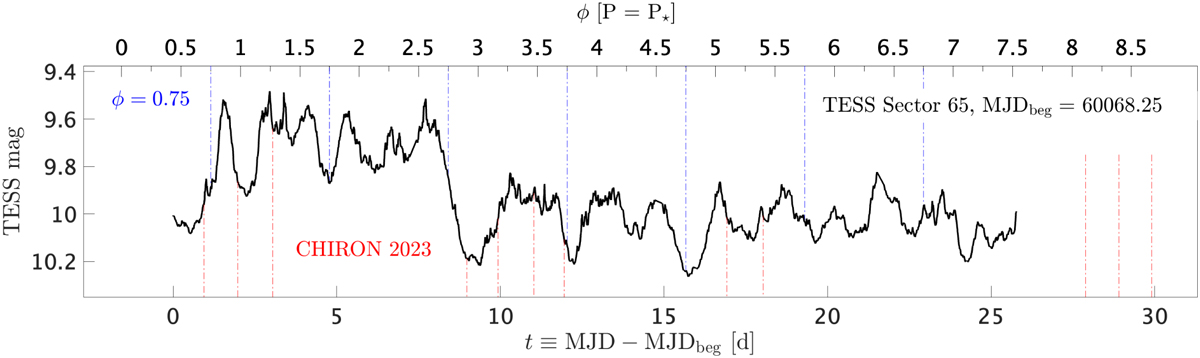
TESS light curve of RU Lup from Sector 65 (2023). The light curve is plotted as a function of the time t from the beginning of the observation (MJDbeg = 60068.25). The top axis show the phase ϕ computed with P = 3.63 days (i.e., the spot period, Sec. 4.1). The reference date for ϕ = 0 is MJD0 ≡ 59264.336. The blue lines mark the phase ϕS (from Sec. 4.1), where the maximum contribution from the hot spot is expected. The red lines mark the epochs of the CHIRON spectroscopic observations.
Current usage metrics show cumulative count of Article Views (full-text article views including HTML views, PDF and ePub downloads, according to the available data) and Abstracts Views on Vision4Press platform.
Data correspond to usage on the plateform after 2015. The current usage metrics is available 48-96 hours after online publication and is updated daily on week days.
Initial download of the metrics may take a while.