Fig. 8
Download original image
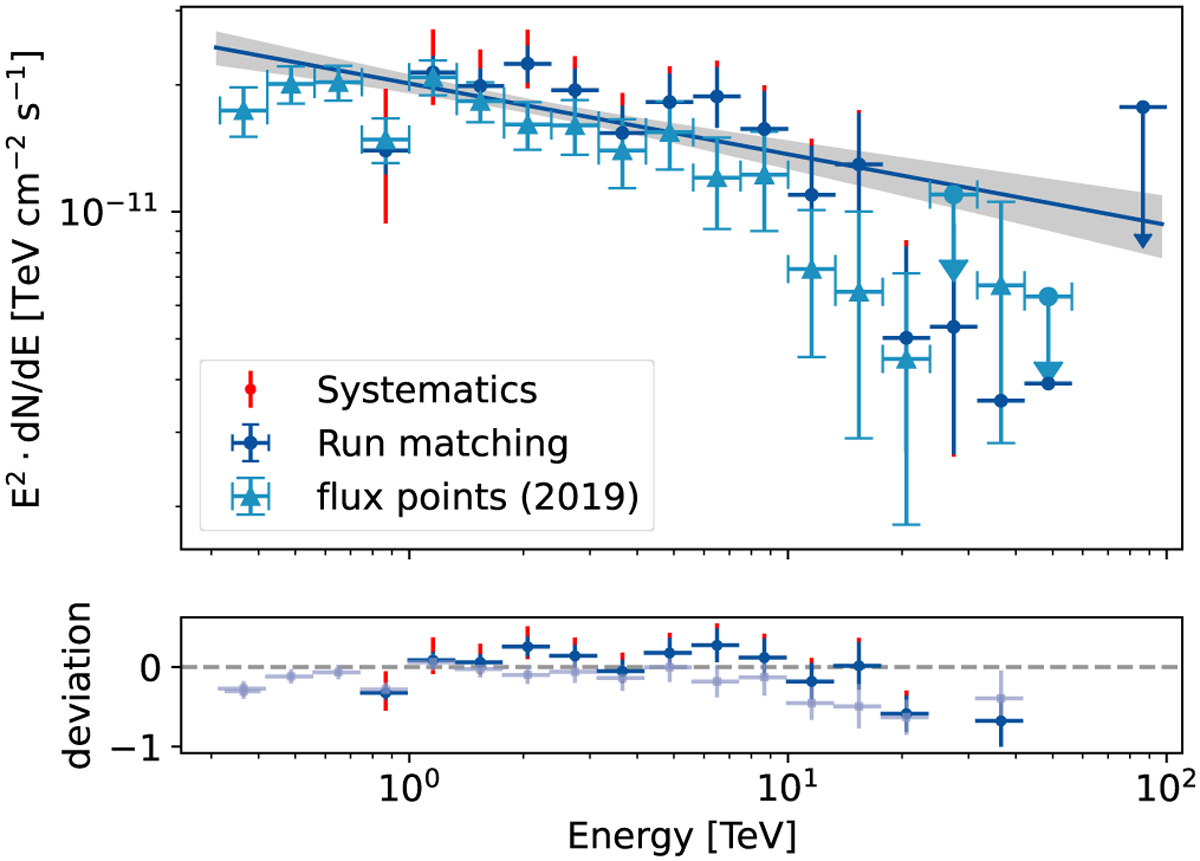
SED of RX J1713.7–3946 derived in the present analysis compared to the SED derived by Mohrmann et al. (2019). The systematic uncertainties added by the run-matching approach are indicated in red in the upper panel. The lower panel shows the deviation between the SED derived in both analyses and the best-fit model derived from the Case 3 dataset.
Current usage metrics show cumulative count of Article Views (full-text article views including HTML views, PDF and ePub downloads, according to the available data) and Abstracts Views on Vision4Press platform.
Data correspond to usage on the plateform after 2015. The current usage metrics is available 48-96 hours after online publication and is updated daily on week days.
Initial download of the metrics may take a while.