Fig. 6
Download original image
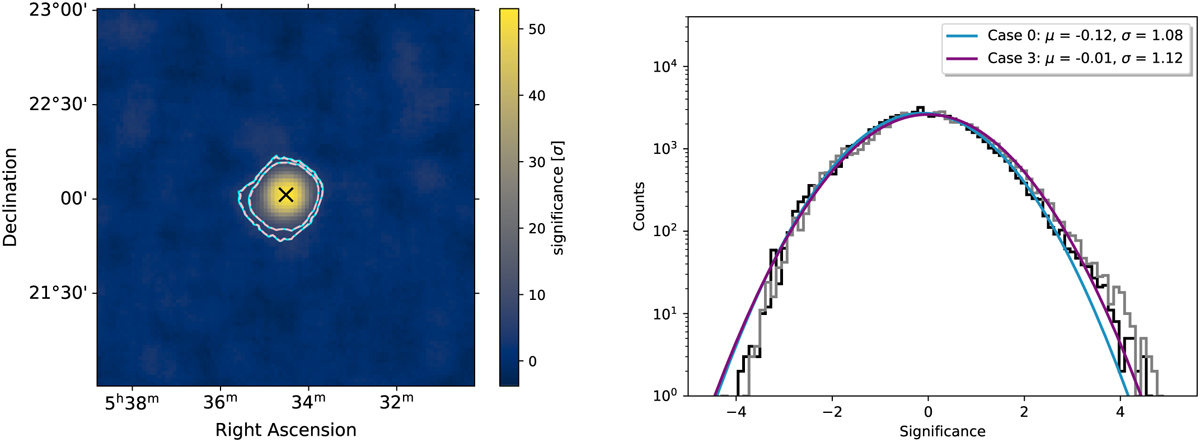
The Region around the Crab Nebula as seen with the H.E.S.S. Telescopes. Left: Li & Ma (1983) significance map of the region with 5 σ and 8 σ contours. The contours from case 0 are depicted in blue, while the contours from case 3 are depicted in pink. The best-fit position is indicated by the black cross. Right: significance distribution of the background in the FoV.
Current usage metrics show cumulative count of Article Views (full-text article views including HTML views, PDF and ePub downloads, according to the available data) and Abstracts Views on Vision4Press platform.
Data correspond to usage on the plateform after 2015. The current usage metrics is available 48-96 hours after online publication and is updated daily on week days.
Initial download of the metrics may take a while.