Fig. 4
Download original image
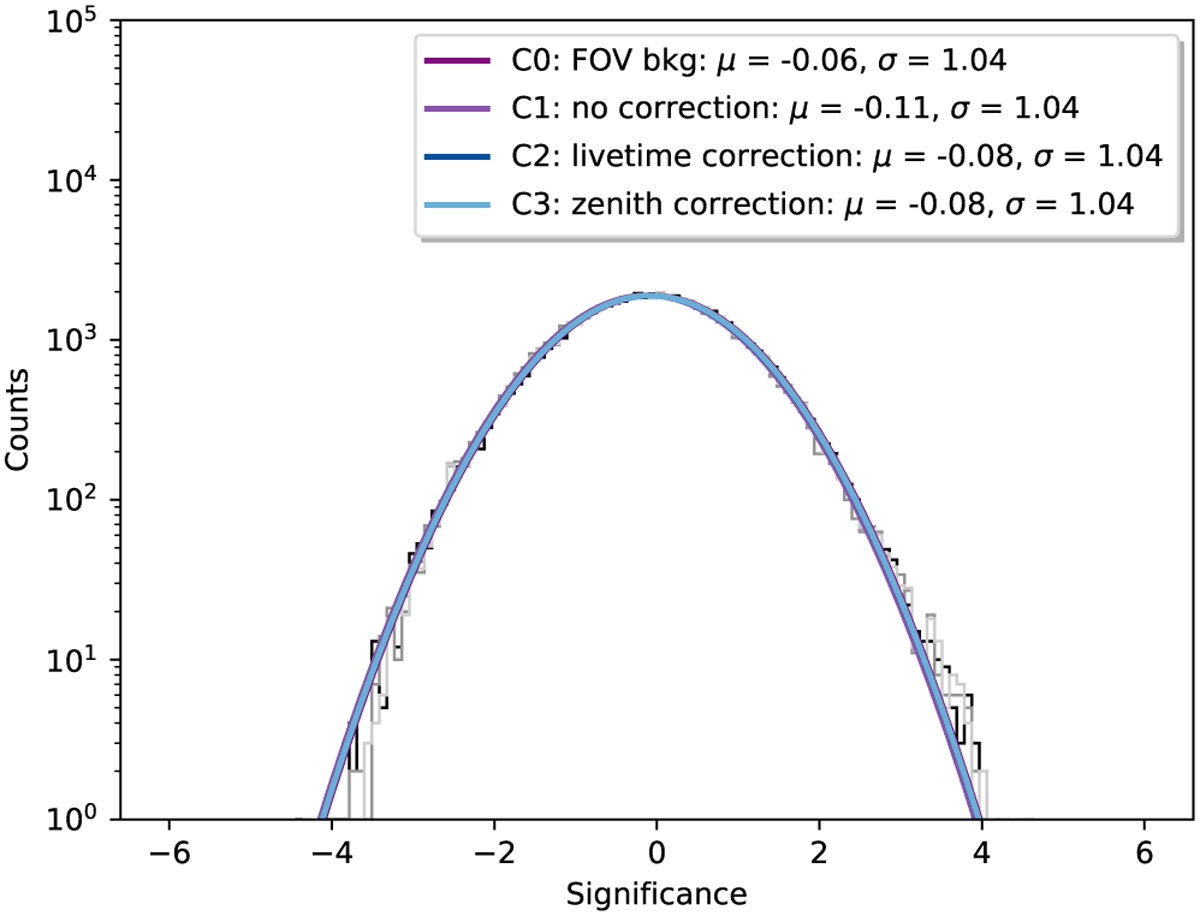
Li & Ma (1983) significance distribution of the observations in the region around the dwarf spheroidal galaxy Reticulum II. Depicted are the distributions for four different estimates of the background; see Table 6. Each of the distributions is shown as a histogram in grey, while a Gaussian fit to each distribution is shown by the coloured lines.
Current usage metrics show cumulative count of Article Views (full-text article views including HTML views, PDF and ePub downloads, according to the available data) and Abstracts Views on Vision4Press platform.
Data correspond to usage on the plateform after 2015. The current usage metrics is available 48-96 hours after online publication and is updated daily on week days.
Initial download of the metrics may take a while.