Open Access
Fig. 2
Download original image
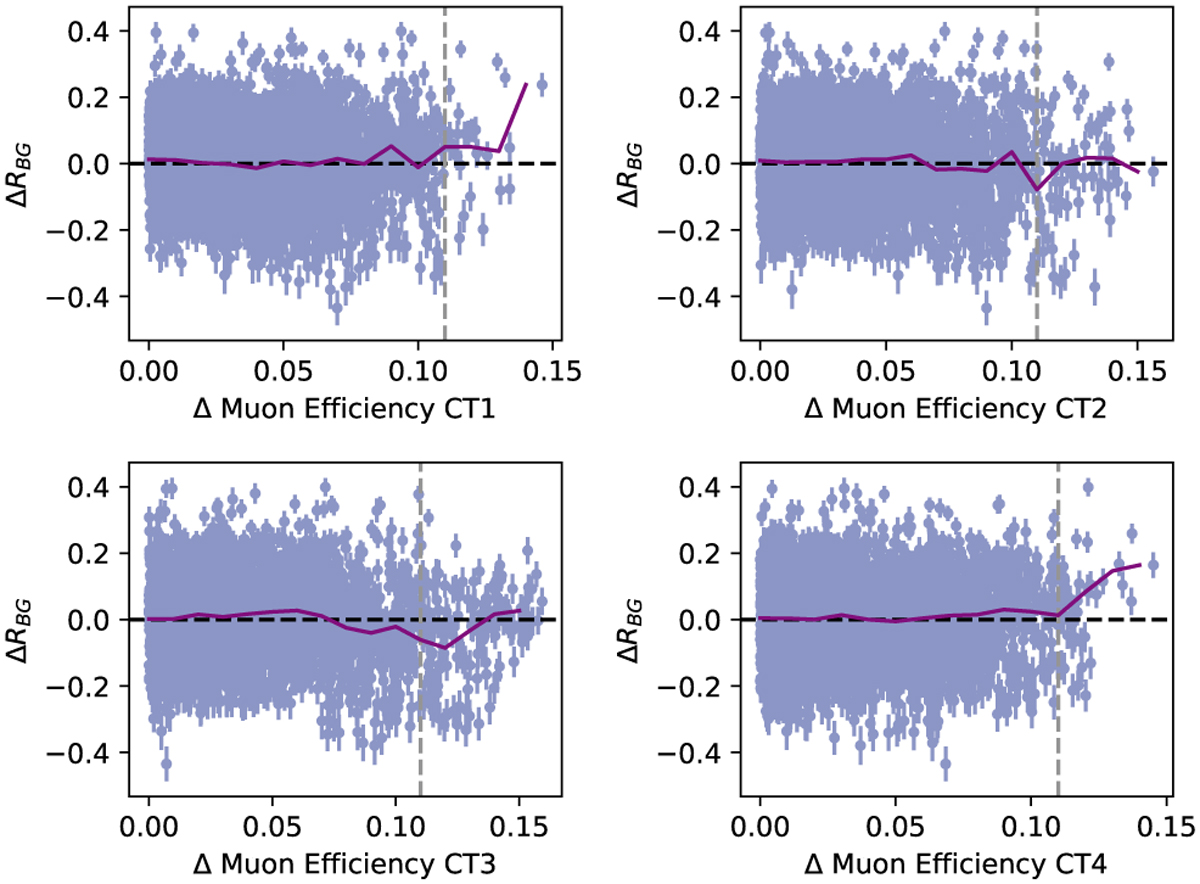
Background rate deviation ΔRBG per difference in muon efficiency for each run pair in set 3 (see Table 5 for more information on the dataset). The case of no deviation between the background rates is depicted by the grey dashed line, and the mean of ΔRBG is depicted by the purple line.
Current usage metrics show cumulative count of Article Views (full-text article views including HTML views, PDF and ePub downloads, according to the available data) and Abstracts Views on Vision4Press platform.
Data correspond to usage on the plateform after 2015. The current usage metrics is available 48-96 hours after online publication and is updated daily on week days.
Initial download of the metrics may take a while.