Open Access
Fig. 3.
Download original image
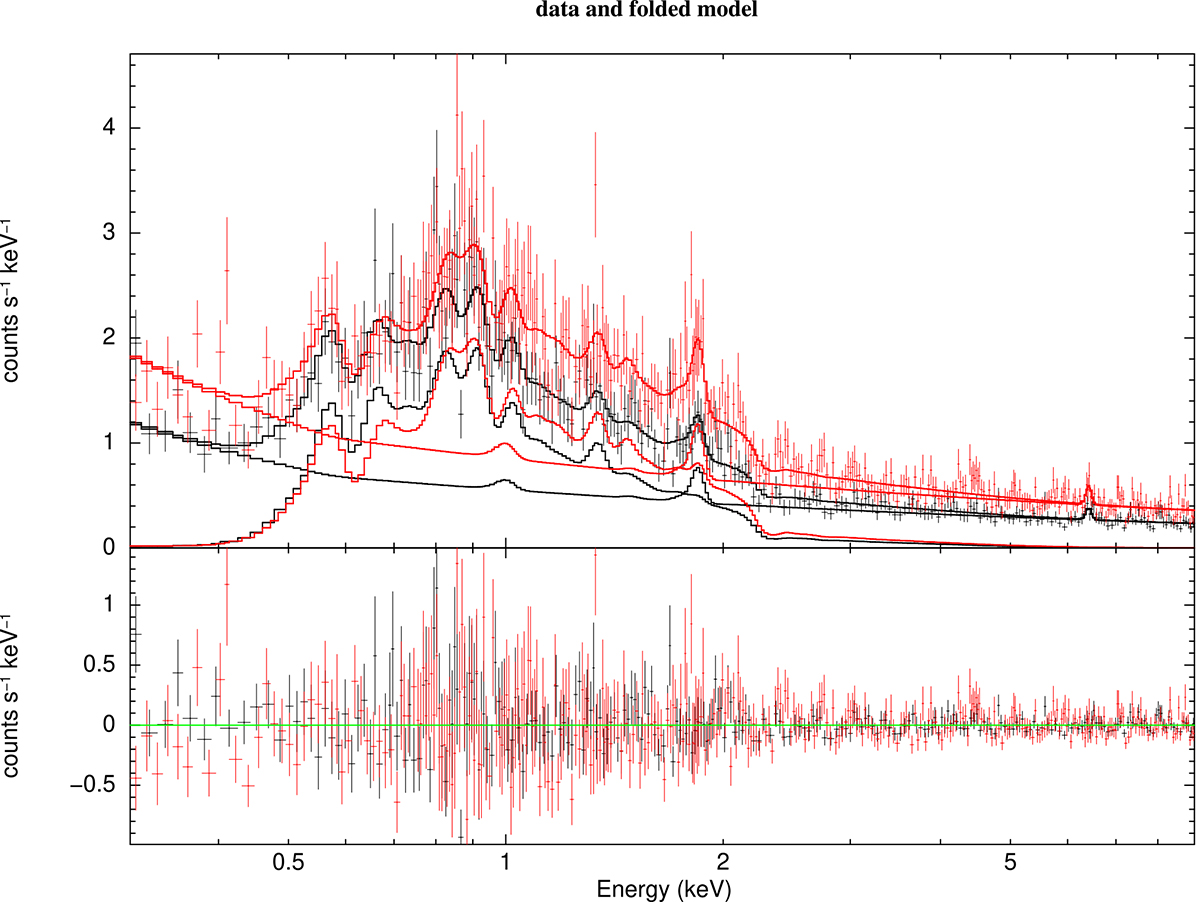
eROSITA spectrum of 1° region. Red points and curve illustrate the spectrum and best-fit model for the ON region; black points and curves the same for the OFF region. The bottom panel illustrates residuals with respect to the selected models.
Current usage metrics show cumulative count of Article Views (full-text article views including HTML views, PDF and ePub downloads, according to the available data) and Abstracts Views on Vision4Press platform.
Data correspond to usage on the plateform after 2015. The current usage metrics is available 48-96 hours after online publication and is updated daily on week days.
Initial download of the metrics may take a while.