Fig. 2
Download original image
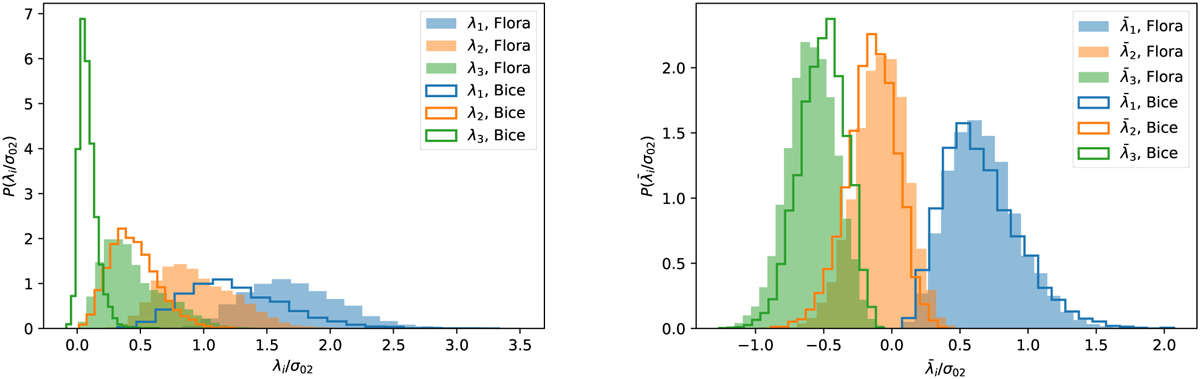
Left panel: distribution of the (normalised) eigenvalues λi of the potential energy overdensity tensor. Filled and open histograms show results for all sampled protohaloes having masses larger than 4 × 10¹⁴h−1 M⊙ (from Flora) and larger than 1011 h−1 M⊙ (from Bice), respectively. Right panel: same, but now for the eigenvalues ![]() of the traceless part of the potential energy overdensity tensor. Filled and open histograms are very similar, indicating that differences in the left panel are mainly driven by the mass-dependence of the trace.
of the traceless part of the potential energy overdensity tensor. Filled and open histograms are very similar, indicating that differences in the left panel are mainly driven by the mass-dependence of the trace.
Current usage metrics show cumulative count of Article Views (full-text article views including HTML views, PDF and ePub downloads, according to the available data) and Abstracts Views on Vision4Press platform.
Data correspond to usage on the plateform after 2015. The current usage metrics is available 48-96 hours after online publication and is updated daily on week days.
Initial download of the metrics may take a while.