Fig. 2
Download original image
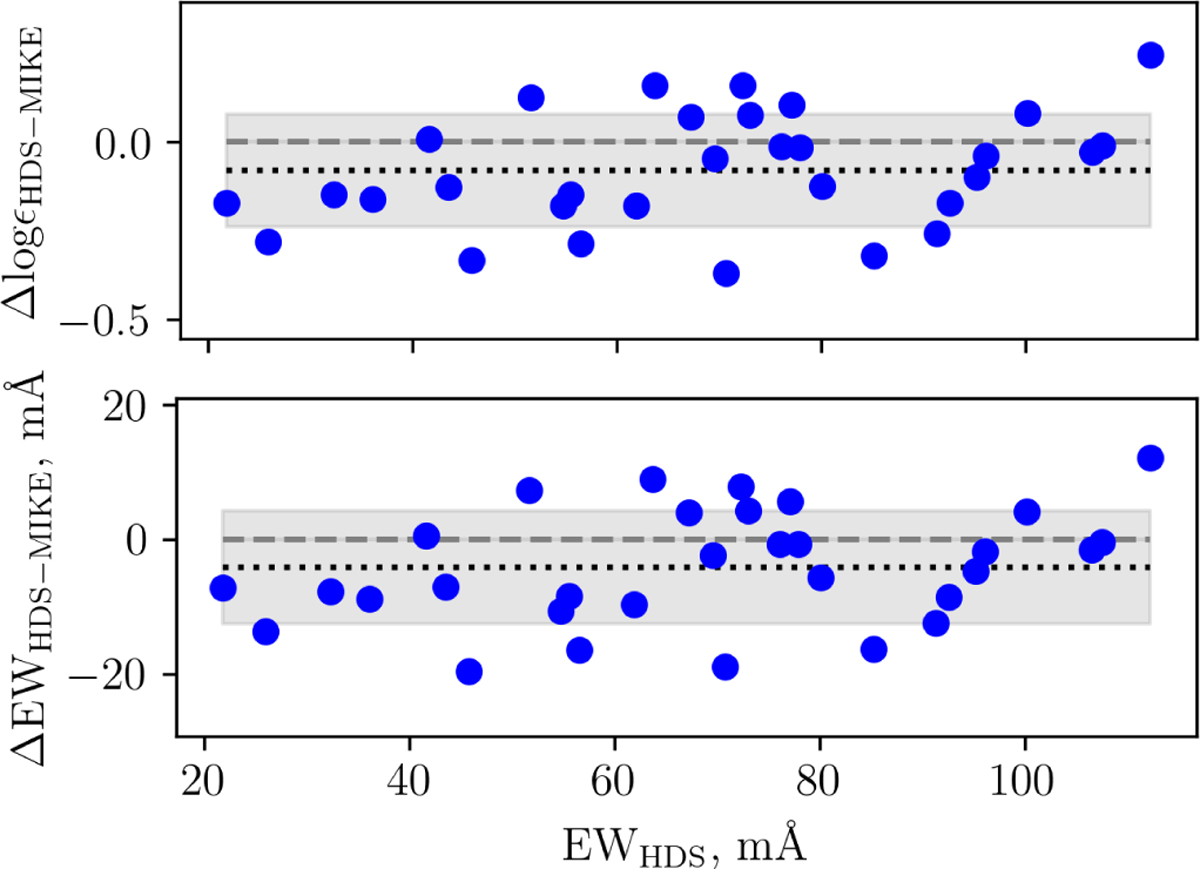
Abundance difference between iron lines measured in Gaia DR3 2505061738639700608 spectra taken with the HDS and MIKE instruments (top panel) and the corresponding abundance differences in EWs (bottom panel) as a function of EW. The dotted lines and shaded areas in both panels represent the mean difference and 1 σ dispersion.
Current usage metrics show cumulative count of Article Views (full-text article views including HTML views, PDF and ePub downloads, according to the available data) and Abstracts Views on Vision4Press platform.
Data correspond to usage on the plateform after 2015. The current usage metrics is available 48-96 hours after online publication and is updated daily on week days.
Initial download of the metrics may take a while.