Fig. 10
Download original image
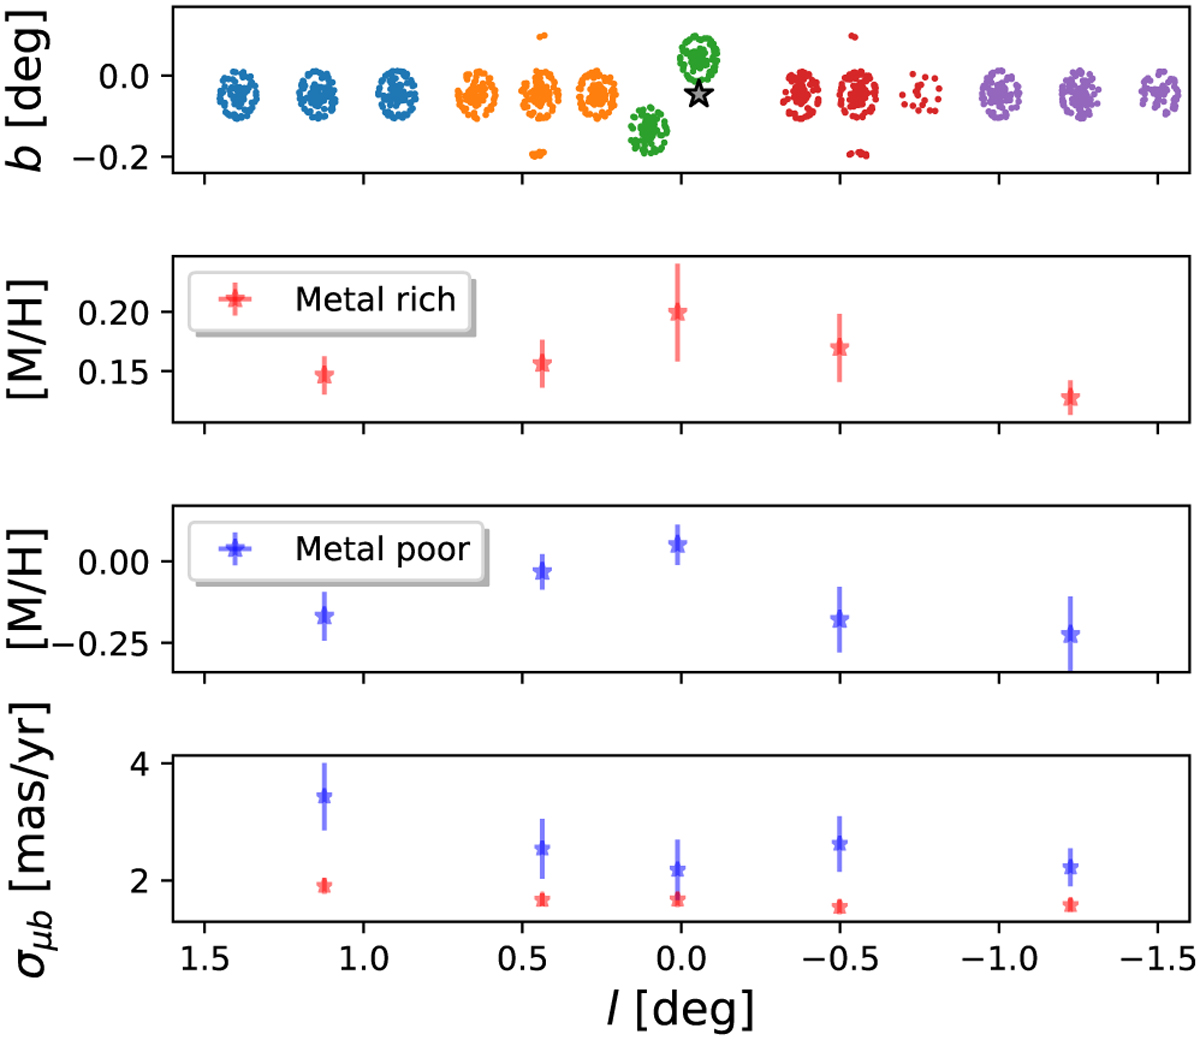
Line-of-sight analysis of the NSD metallicity and kinematics (the corresponding values are included in Table. A.1). Top panel: Target KMOS stars divided into five colour-coded regions at different longitudes. The grey star indicates the position of Sgr A*. Middle panels: mean metallicity obtained for the metal-rich (top) and the metal-poor (bottom) components of the two-Gaussian distribution. We plot metal-rich and metal-poor stars separately to highlight the detected gradients more effectively. Bottom panel: velocity dispersion of µb for the metal-rich and metal-poor components.
Current usage metrics show cumulative count of Article Views (full-text article views including HTML views, PDF and ePub downloads, according to the available data) and Abstracts Views on Vision4Press platform.
Data correspond to usage on the plateform after 2015. The current usage metrics is available 48-96 hours after online publication and is updated daily on week days.
Initial download of the metrics may take a while.