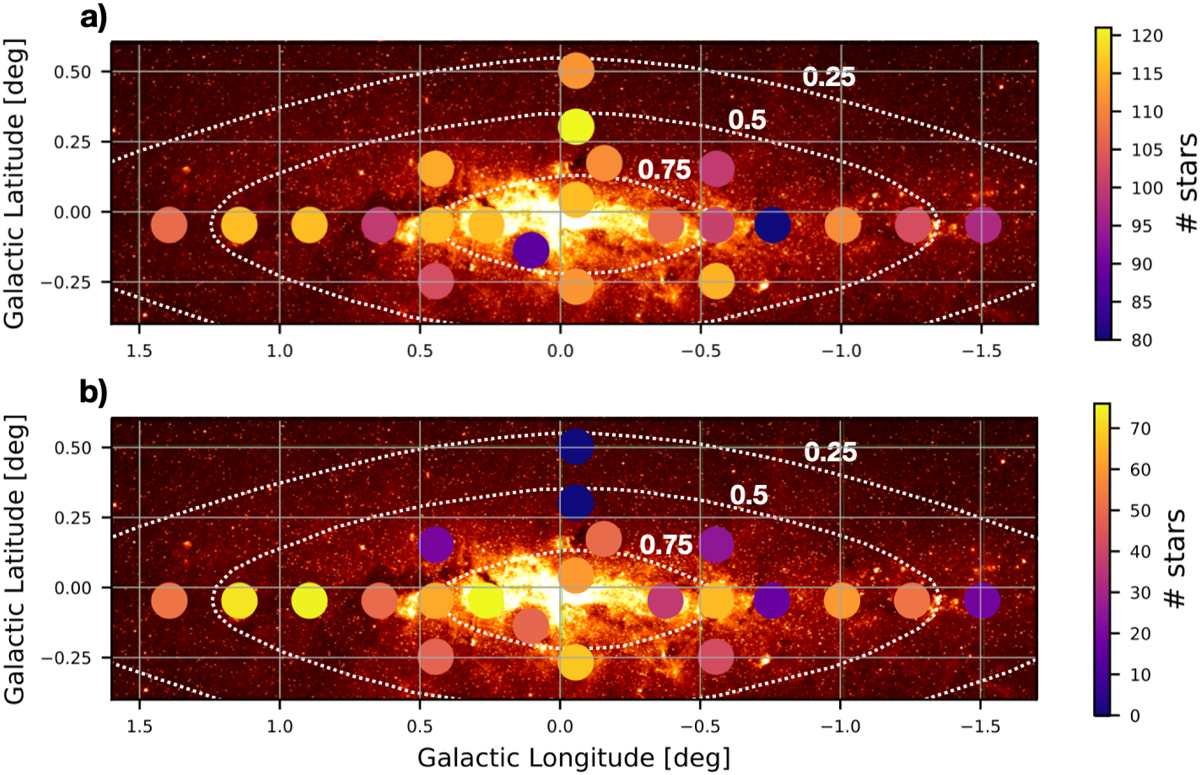
Fig. 1
Download original image
Scheme of the observed region overplotted on a Spitzer/IRAC image at 8 µm. (Stolovy et al. 2006). This wavelength highlights the bright and dusty clouds that outline the NSD. a) KMOS fields in which the colour scale indicates the star counts. b) Number of stars per field with computed orbits (Nieuwmunster et al. 2024). The two northernmost fields do not contain any stars due to the selection criteria used to create the orbital catalogue (|l| < 1.5° and |b| < 0.3°; for further details, see Nieuwmunster et al. 2024). The dotted contours show the 25, 50, and 75% levels of the NSD self-consistent model obtained by Sormani et al. (2022).
Current usage metrics show cumulative count of Article Views (full-text article views including HTML views, PDF and ePub downloads, according to the available data) and Abstracts Views on Vision4Press platform.
Data correspond to usage on the plateform after 2015. The current usage metrics is available 48-96 hours after online publication and is updated daily on week days.
Initial download of the metrics may take a while.