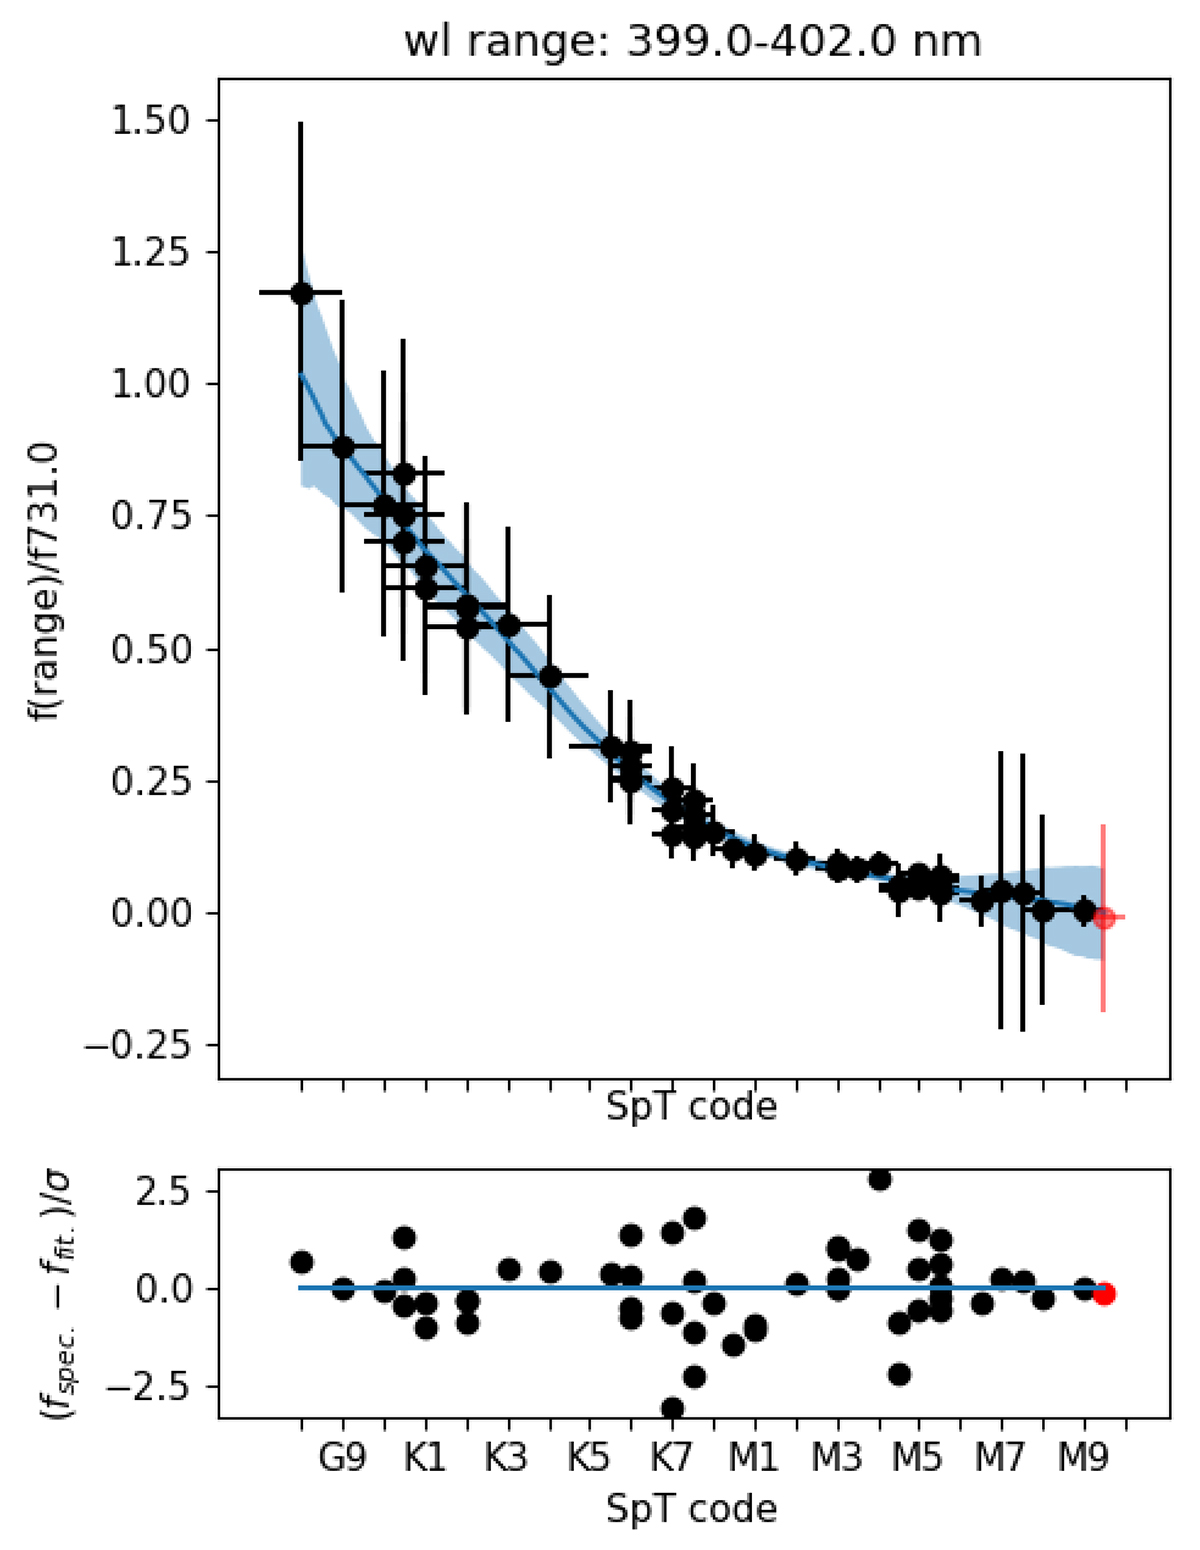
Fig. 6.
Download original image
Example of a local polynomial fit to the normalized fluxes (black points) extracted in the wavelength range of 399–402 nm. The red point have been excluded from the fit due to the low S/R of this spectrum. The blue line indicates the median fit resulting from the Monte Carlo simulation. The transparent blue region indicates the 1-σ uncertainty interval. The residuals are computed using only the uncertainties on the non-parametric fit.
Current usage metrics show cumulative count of Article Views (full-text article views including HTML views, PDF and ePub downloads, according to the available data) and Abstracts Views on Vision4Press platform.
Data correspond to usage on the plateform after 2015. The current usage metrics is available 48-96 hours after online publication and is updated daily on week days.
Initial download of the metrics may take a while.