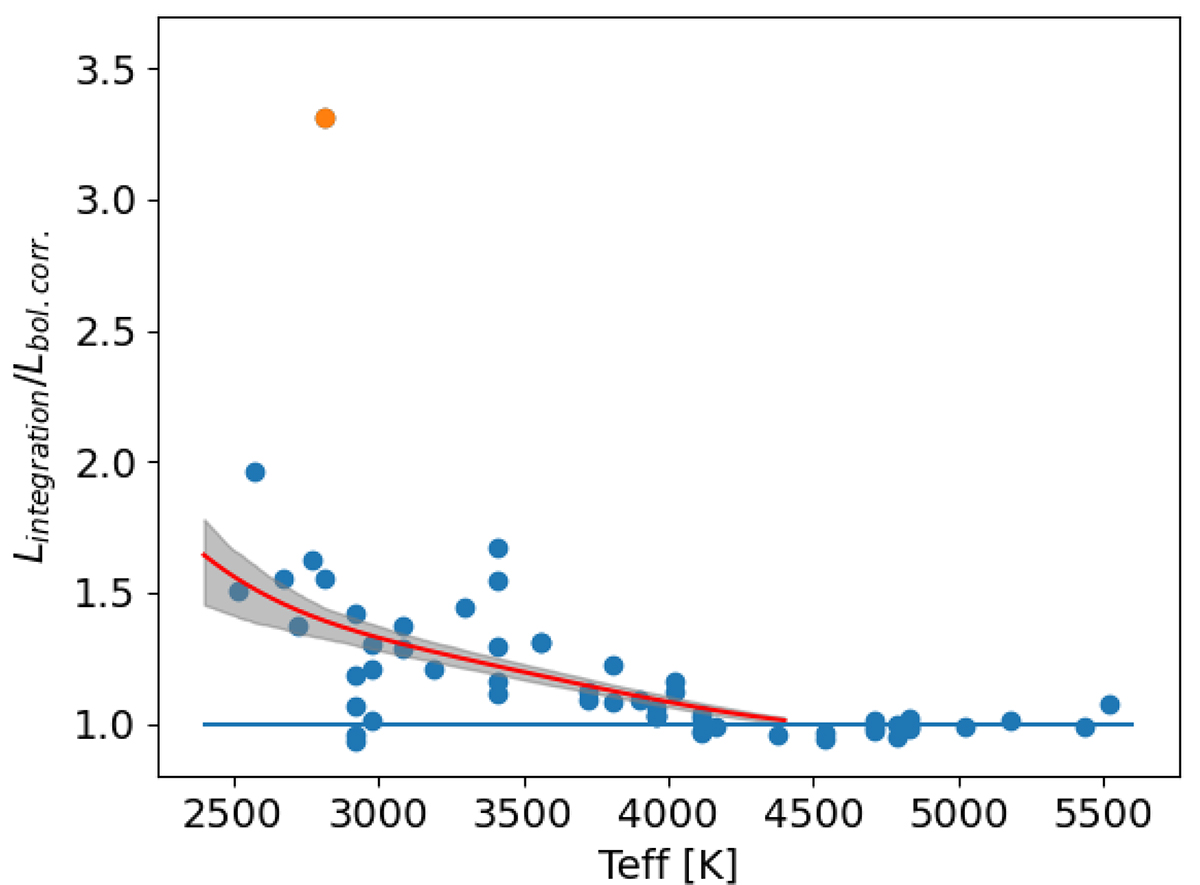
Fig. C.2.
Download original image
Ratio of the luminosities obtained from our spectral integration method and the value computed using the bolometric correction of (HH14). The blue dots indicate the values obtained for the spectra presented here aswell as in (MTR13) and (MFA17). The red line indicates the non-parametric fit, and the shaded area indicates the corresponding 1σ uncertainty interval obtained from bootstrapping the non-parametric fitting procedure. The orange point is Par-Lup3-1, which was excluded from this procedure.
Current usage metrics show cumulative count of Article Views (full-text article views including HTML views, PDF and ePub downloads, according to the available data) and Abstracts Views on Vision4Press platform.
Data correspond to usage on the plateform after 2015. The current usage metrics is available 48-96 hours after online publication and is updated daily on week days.
Initial download of the metrics may take a while.