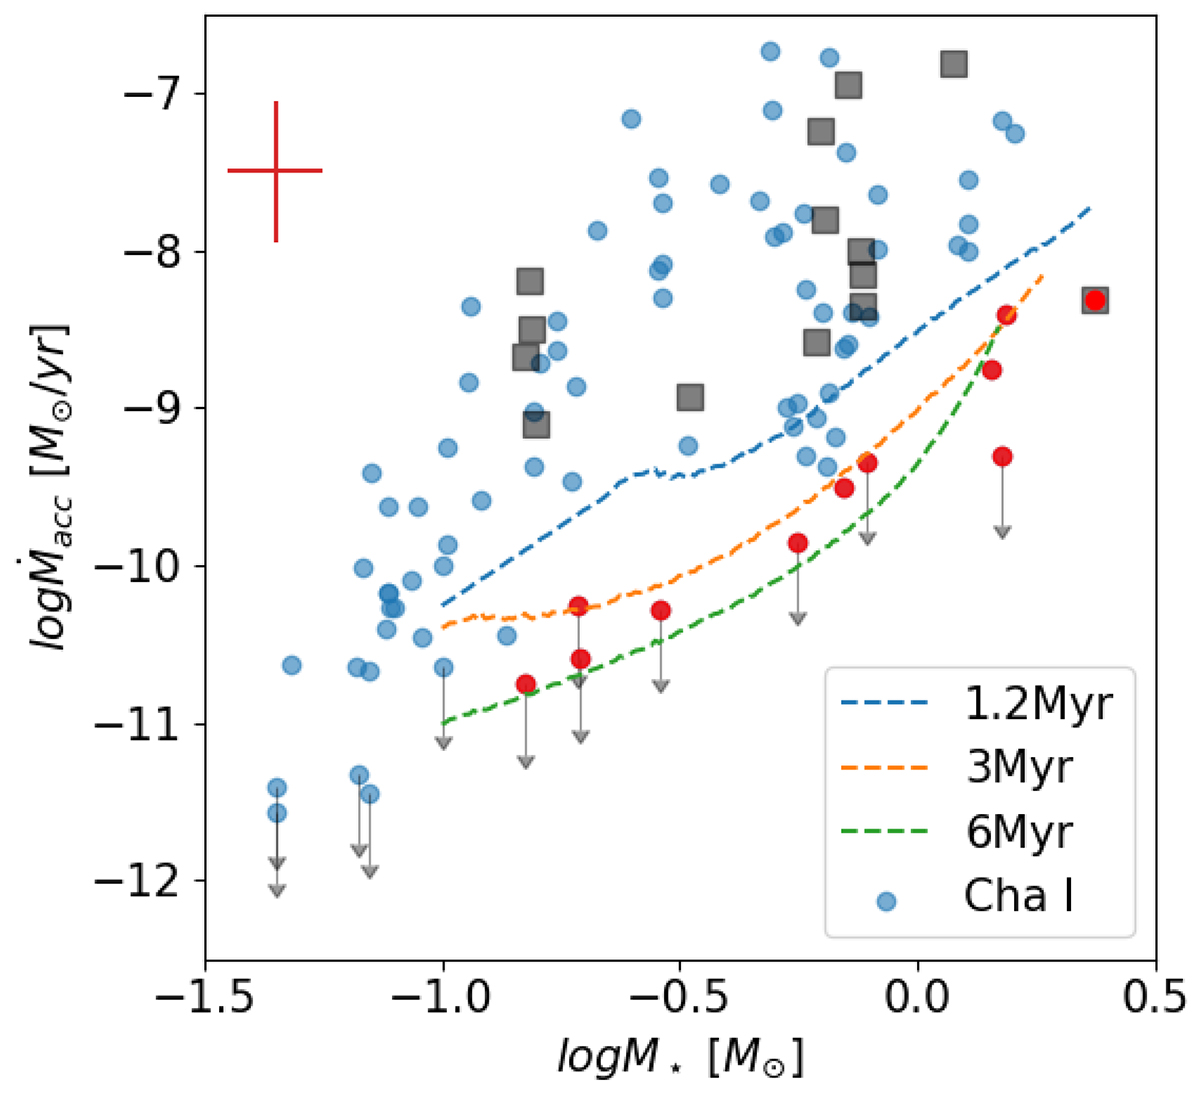
Fig. 13.
Download original image
Mass accretion rate vs. stellar mass for the Chamaeleon I sample presented by Manara et al. (2023) (blue dots) and the Chamaeleon I sample analyzed in this work. Objects that have an accretion luminosity lower than the criterion given in Eq. (6) are marked with a red dot. The limits we derived based on the uncertainties on the chromospheric emission are shown with the blue, orange, and green lines for 1.2, 3, and 6 Myr old objects respectively. The red errorbars indicate the uncertainties on the stellar mass and mass accretion rate. The gray arrows indicate sources listed as upper limits by Manara et al. (2023).
Current usage metrics show cumulative count of Article Views (full-text article views including HTML views, PDF and ePub downloads, according to the available data) and Abstracts Views on Vision4Press platform.
Data correspond to usage on the plateform after 2015. The current usage metrics is available 48-96 hours after online publication and is updated daily on week days.
Initial download of the metrics may take a while.