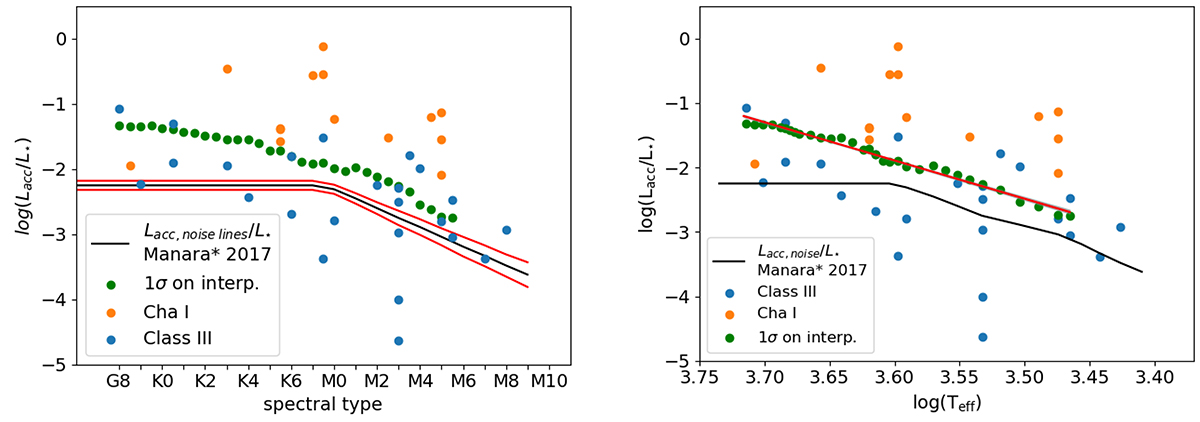
Fig. 12.
Download original image
SpT and Teff depedency of the accretion noise log(Lacc, noise/L⋆) values obtained from interpreting the uncertainties in the Balmer and Paschen continuum (< 500 nm) on our model class III spectra as accretion (green dots). The blue dots illustrate the log(Lacc, noise/L⋆) values obtained when fitting the class III spectra with an accretion slab model. The results obtained for the PENELLOPE Chamaeleon I sample is indicated with orange dots. The black line shows the Lacc, noise relationship measured from the emission lines by MFA17 and the red lines on the left show the uncertainty thereon. On the right, the red line illustrates the best fit to the log(Lacc, noise/L⋆) values.
Current usage metrics show cumulative count of Article Views (full-text article views including HTML views, PDF and ePub downloads, according to the available data) and Abstracts Views on Vision4Press platform.
Data correspond to usage on the plateform after 2015. The current usage metrics is available 48-96 hours after online publication and is updated daily on week days.
Initial download of the metrics may take a while.