Fig. 11.
Download original image
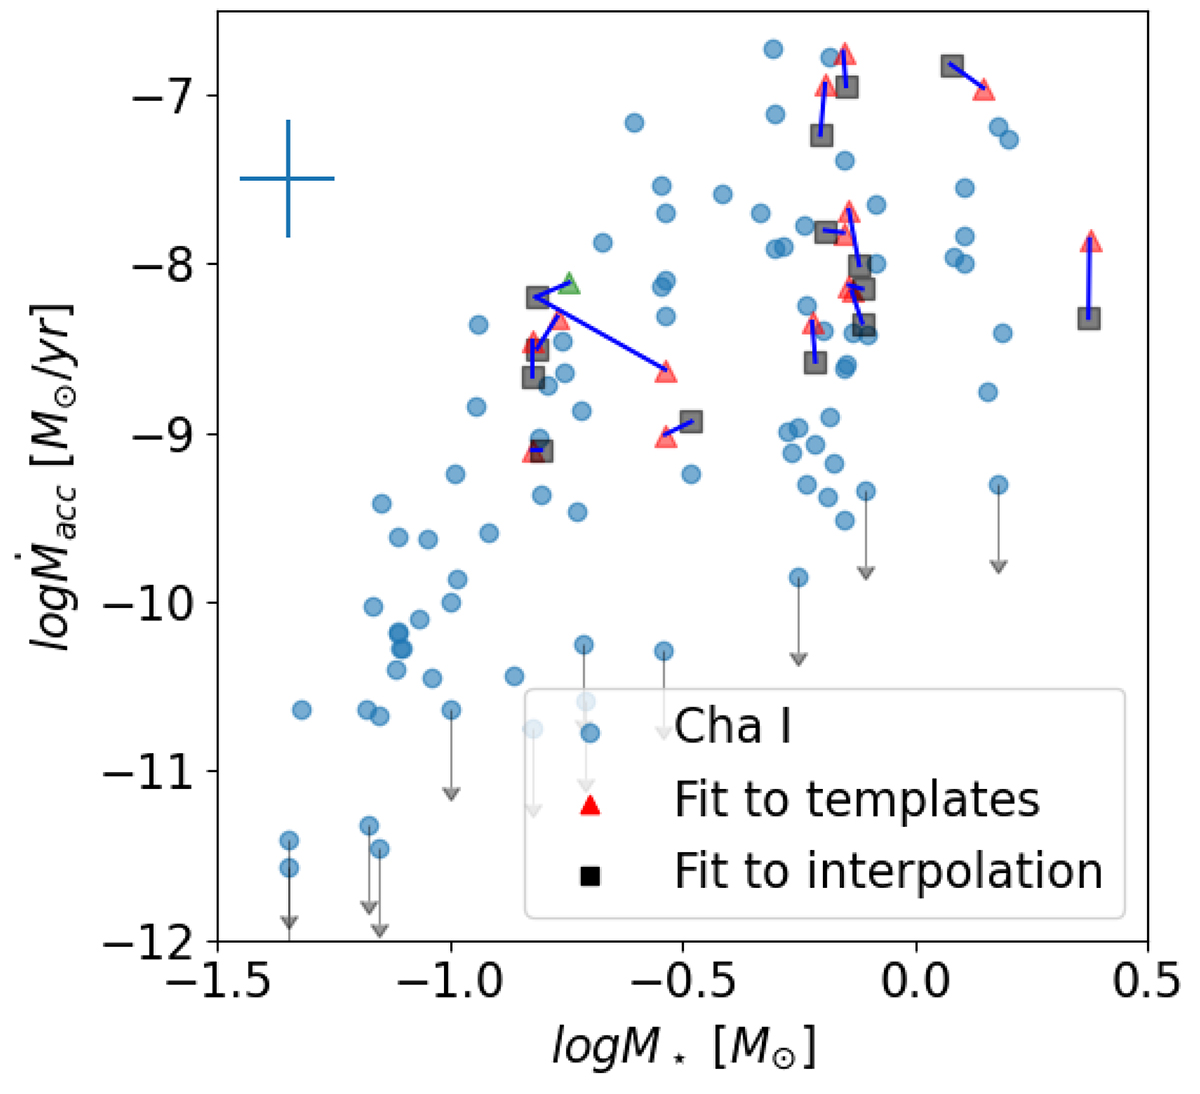
Mass accretion rate vs. stellar mass as obtained using FRAPPE (red triangles) and obtained using the method of Manara et al. (2013b) (gray squares). Results obtained for the same target with the two methods are connected with a blue line. The green triangle indicates the M5 solution of WZ Cha. The light blue dots are the nearly complete Chamaeleon I sample presented by Manara et al. (2013a). The blue errorbars indicate the uncertainties on the stellar mass and mass accretion rate. The gray arrows indicate sources listed as upper limits by Manara et al. (2023).
Current usage metrics show cumulative count of Article Views (full-text article views including HTML views, PDF and ePub downloads, according to the available data) and Abstracts Views on Vision4Press platform.
Data correspond to usage on the plateform after 2015. The current usage metrics is available 48-96 hours after online publication and is updated daily on week days.
Initial download of the metrics may take a while.