Fig. A.2
Download original image
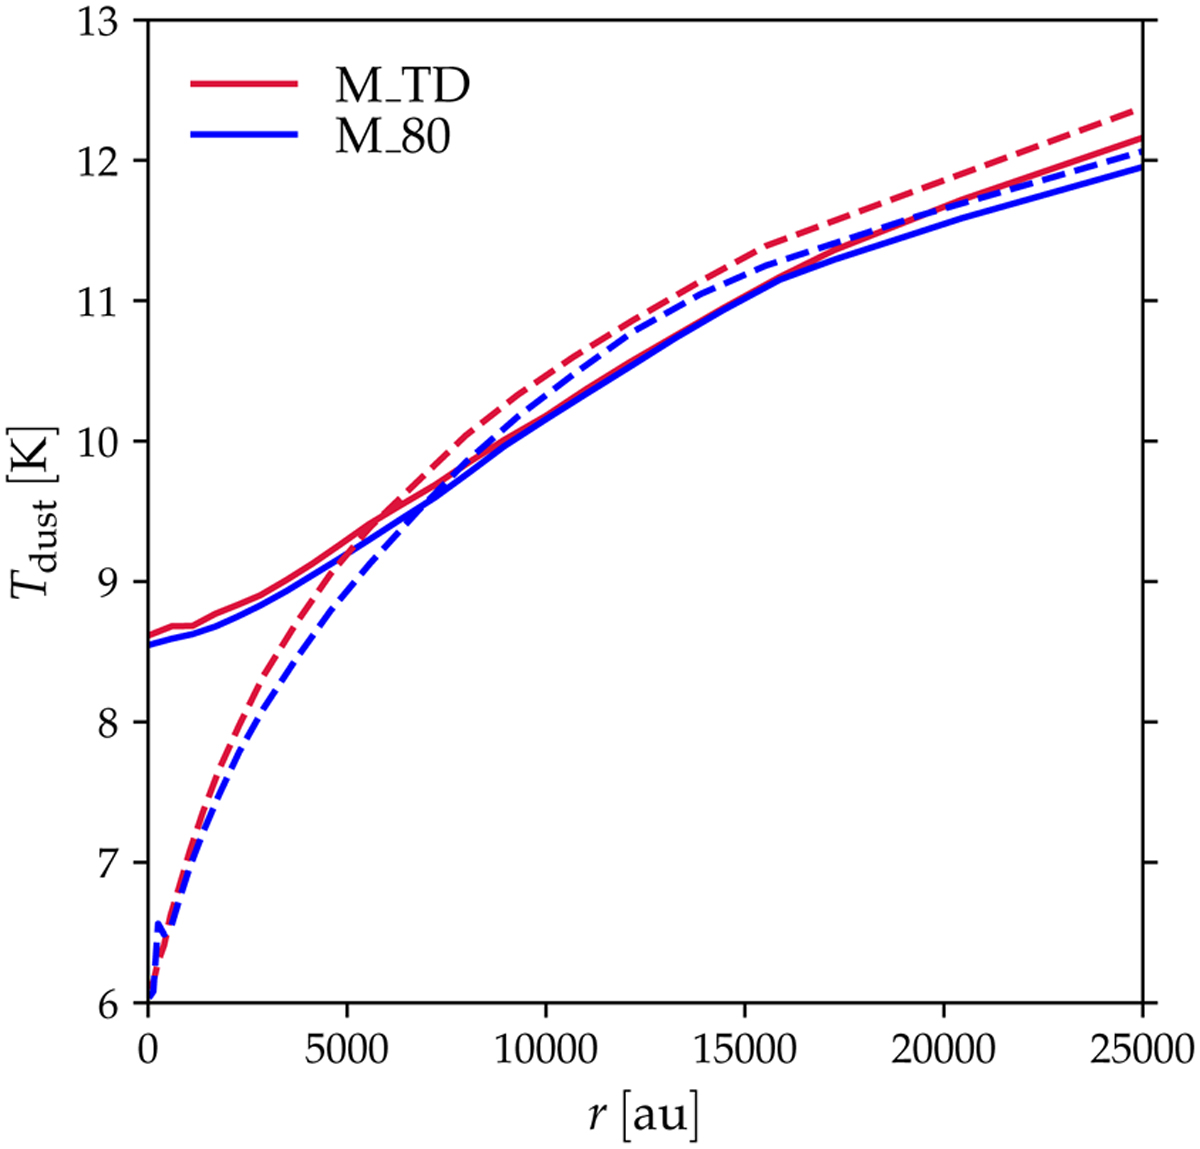
Snapshots of the dust temperature as a function of radius in simulations M_TD and M_80 at the time when the central density of the core hits either n(H2) = 105 cm−3 (solid lines) or n(H2) = 107 cm−3 (dashed lines). In contrast to Fig. 2, the differences between the curves are not shown separately as they are very minor (on the order of 0.1 K).
Current usage metrics show cumulative count of Article Views (full-text article views including HTML views, PDF and ePub downloads, according to the available data) and Abstracts Views on Vision4Press platform.
Data correspond to usage on the plateform after 2015. The current usage metrics is available 48-96 hours after online publication and is updated daily on week days.
Initial download of the metrics may take a while.