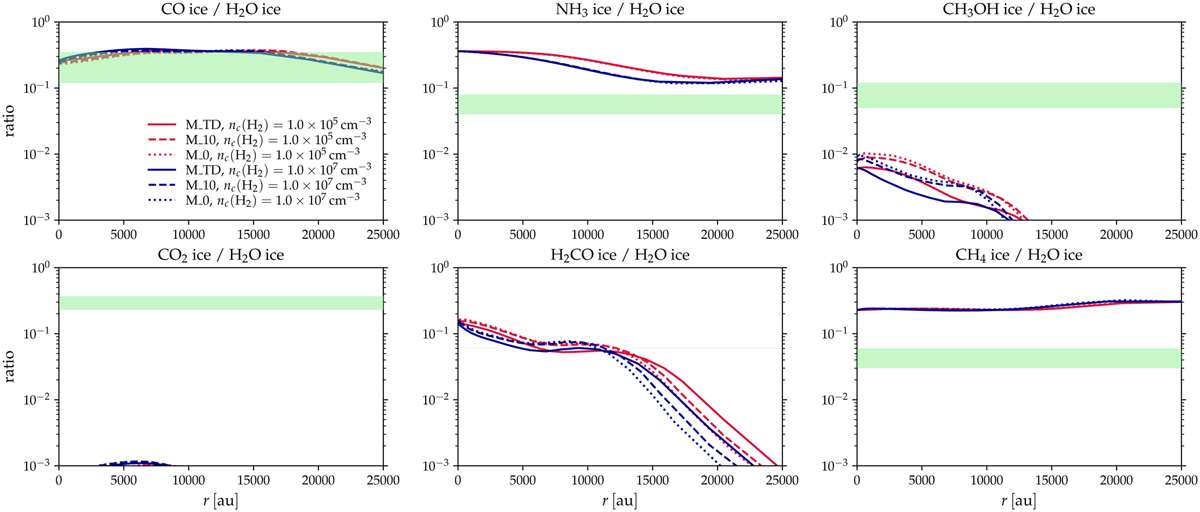
Fig. 7
Download original image
Abundance ratios of selected ice molecules to water ice as a function of the radius in simulations M_TD, M_10, and M_0, plotted on a common y-axis scale to ease the comparison. Profiles are shown for two different values of the central H2 density: 105 (red) and 107 cm−3 (blue). Solid, dashed, and dotted lines correspond to simulation M_TD, M_10, and M_0, respectively. The light green bands show the ratios derived from observations toward low-mass young stellar objects (Boogert et al. 2015).
Current usage metrics show cumulative count of Article Views (full-text article views including HTML views, PDF and ePub downloads, according to the available data) and Abstracts Views on Vision4Press platform.
Data correspond to usage on the plateform after 2015. The current usage metrics is available 48-96 hours after online publication and is updated daily on week days.
Initial download of the metrics may take a while.