Fig. 6
Download original image
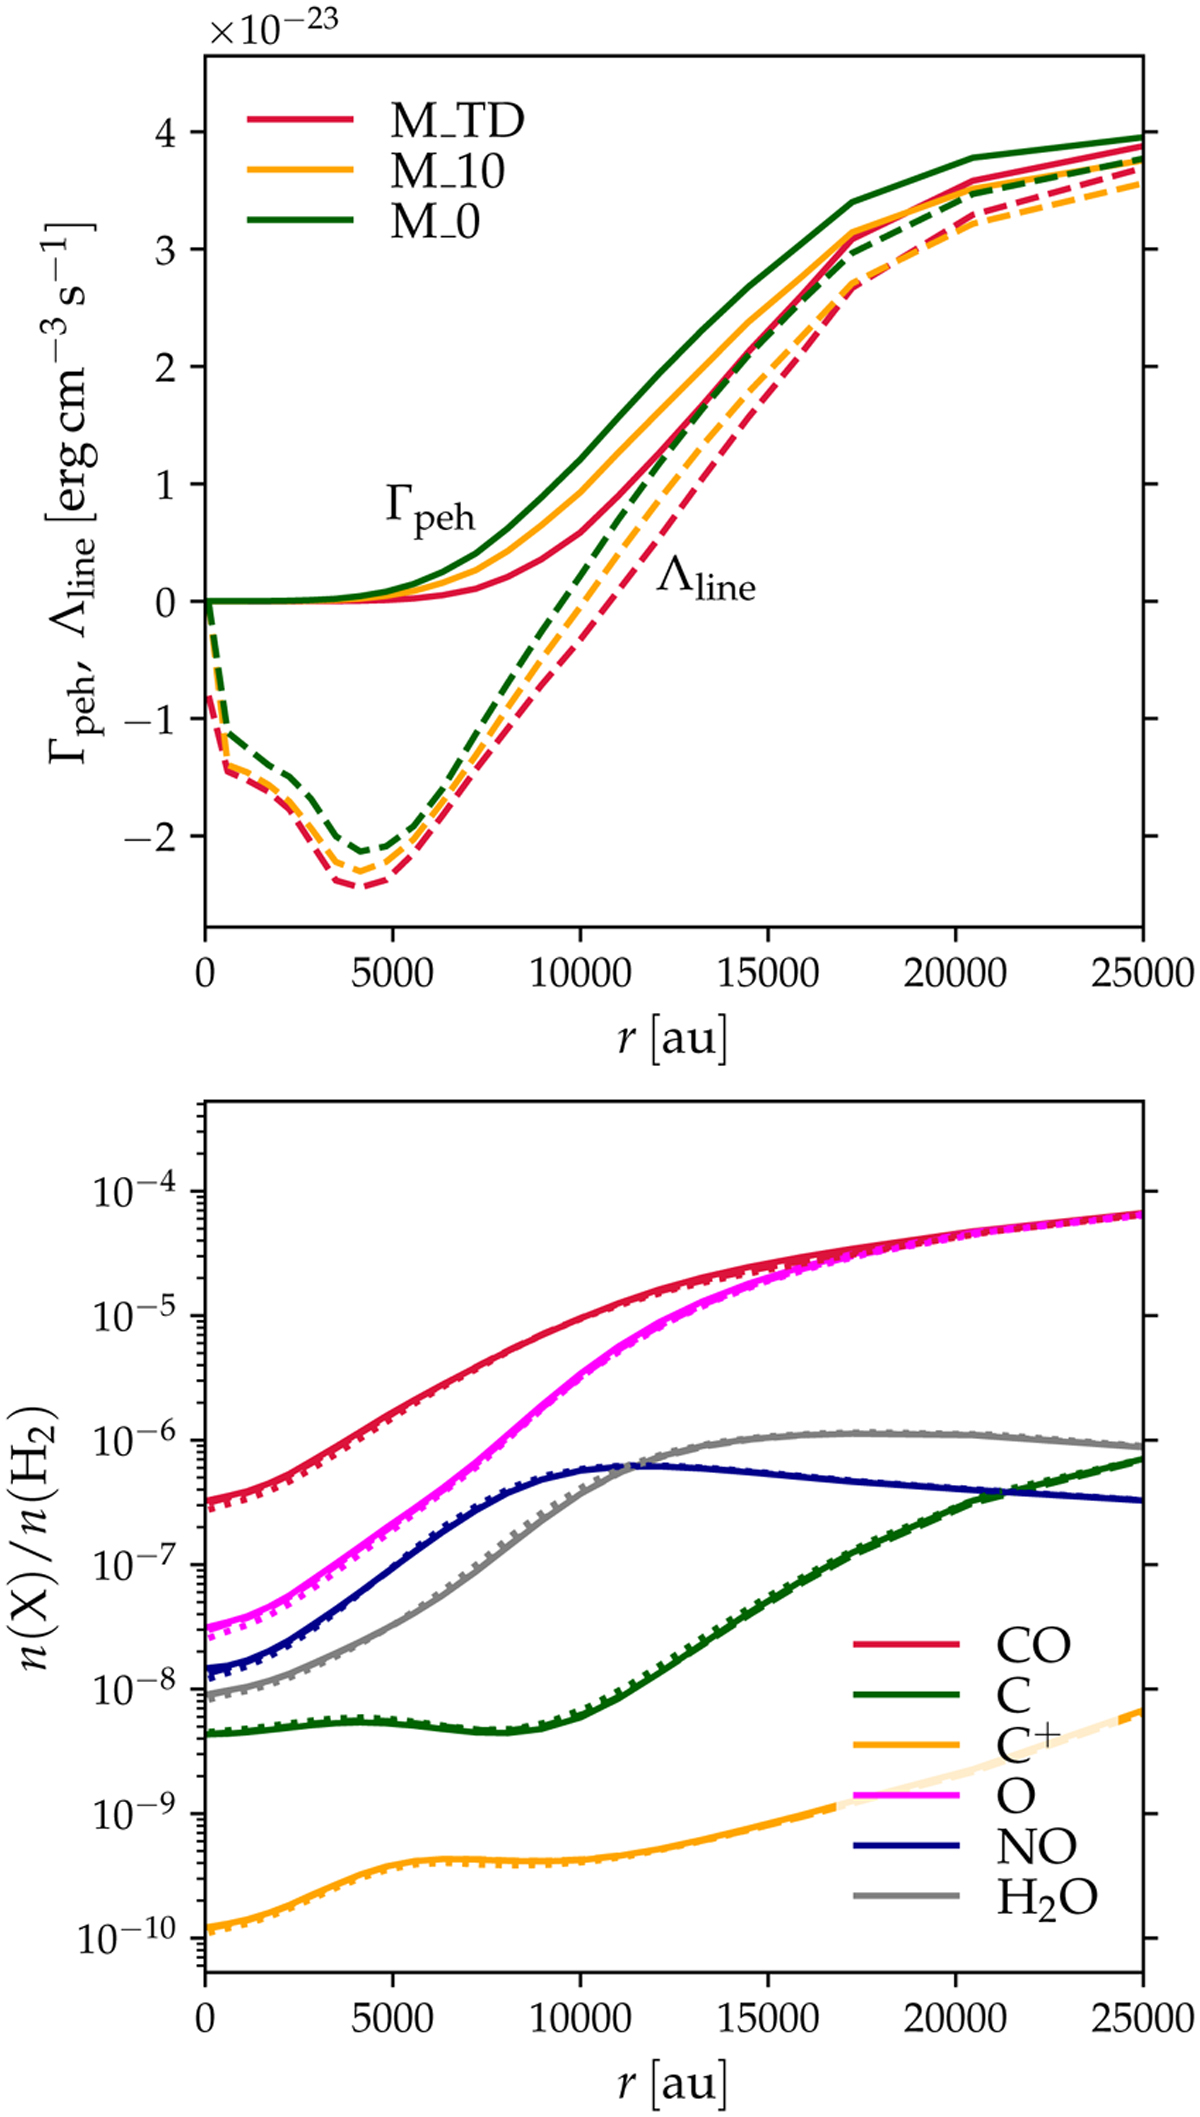
Line cooling (Λline; dashed lines) and photoelectric heating (Γpeh; solid lines) rates as a function of radius at the time when the central density is n(H2) = 105 cm−3 in simulations M_TD, M_10, and M_0 (top panel). Radial distributions of selected cooling molecules at the same time (bottom panel). In this panel, solid, dashed, and dotted lines represent simulations M_TD, M_10, and M_0, respectively, but they overlap almost perfectly.
Current usage metrics show cumulative count of Article Views (full-text article views including HTML views, PDF and ePub downloads, according to the available data) and Abstracts Views on Vision4Press platform.
Data correspond to usage on the plateform after 2015. The current usage metrics is available 48-96 hours after online publication and is updated daily on week days.
Initial download of the metrics may take a while.