Fig. 5
Download original image
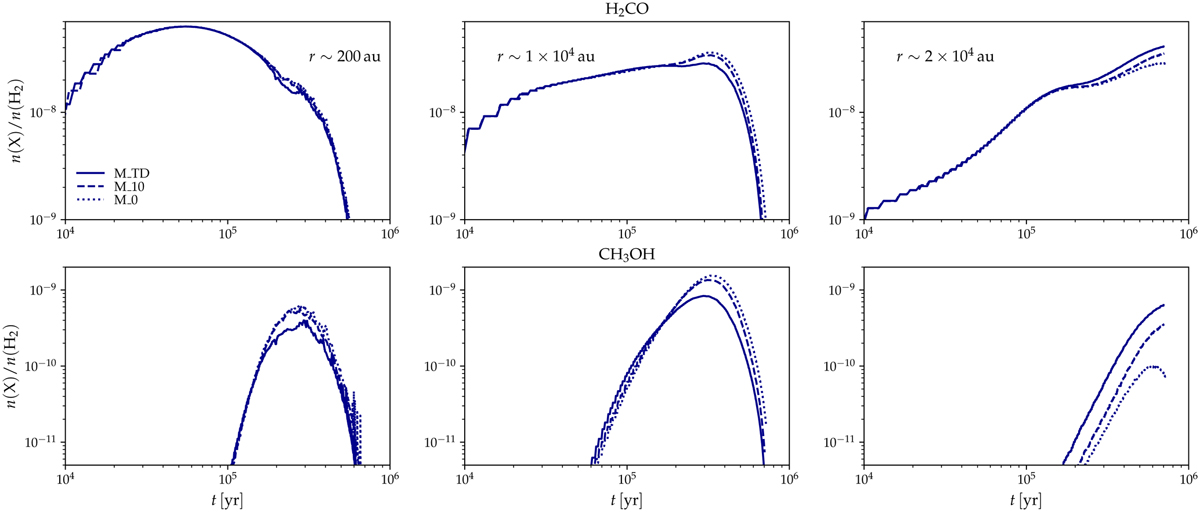
Abundances of gas-phase H2CO (top panels) and CH3OH (bottom panels) with respect to H2 as a function of the time in simulations M_TD (solid lines), M_10 (dashed lines), and M_0 (dotted lines). From left to right, the columns show the evolution in a cell that starts at r ~ 200 au, r ~ 1 × 10⁴ au, or r ~ 2 × 10⁴ au. The noise in the CH3OH abundances in the innermost cell reflects the temperature fluctuations (Fig. 1), which affect the abundance of hydrogen on the grain surface (gas-phase CH3OH is mostly coming from chemical desorption of methanol formed by the CH3O + H reaction on the grains).
Current usage metrics show cumulative count of Article Views (full-text article views including HTML views, PDF and ePub downloads, according to the available data) and Abstracts Views on Vision4Press platform.
Data correspond to usage on the plateform after 2015. The current usage metrics is available 48-96 hours after online publication and is updated daily on week days.
Initial download of the metrics may take a while.