Fig. 4
Download original image
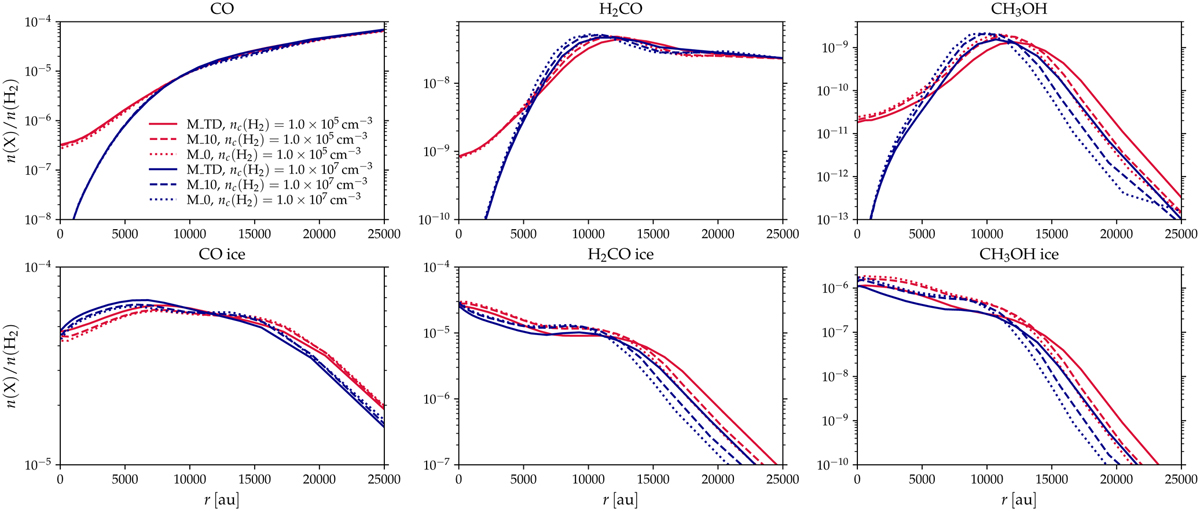
Abundances of selected gas-phase (top panels) and ice (bottom panels) molecules with respect to H2 as a function of the radius in simulations M_TD, M_10, and M_0. Profiles are shown for two different values of the central H2 density: 105 (red) and 107 cm−3 (blue). Solid, dashed, and dotted lines correspond to simulation M_TD, M_10, and M_0, respectively. The central density of 105 cm−3 corresponds to t = 5.50 × 10⁵ yr, t = 5.57 × 10⁵ yr, and t = 5.74 × 10⁵ yr in simulations M_TD, M_10, and M_0, respectively. The corresponding values for central density 107 cm−3 are given in Table 4.
Current usage metrics show cumulative count of Article Views (full-text article views including HTML views, PDF and ePub downloads, according to the available data) and Abstracts Views on Vision4Press platform.
Data correspond to usage on the plateform after 2015. The current usage metrics is available 48-96 hours after online publication and is updated daily on week days.
Initial download of the metrics may take a while.