Fig. 2
Download original image
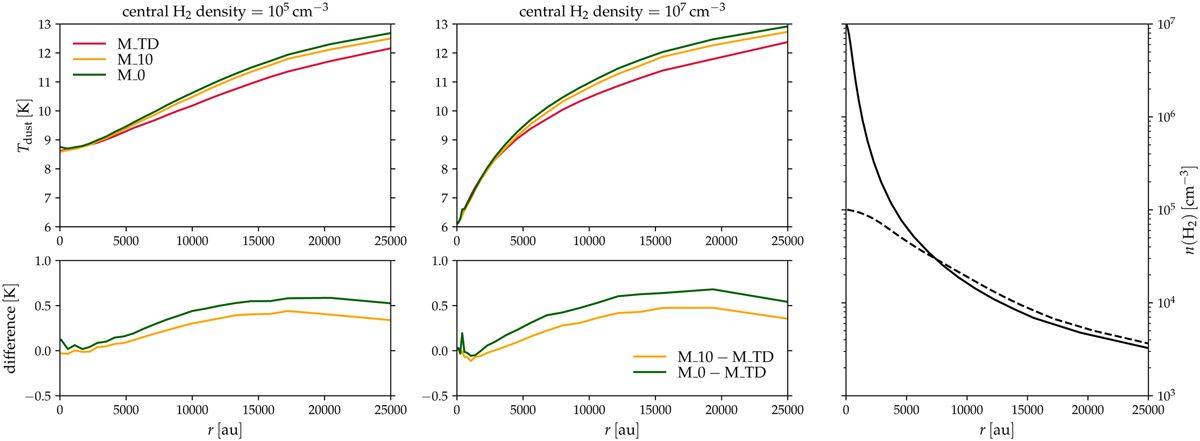
Snapshots of the dust temperature as a function of the radius in simulations M_TD, M_10, and M_0 at the time when the central density of the core hits either n(H2) = 105 cm−3 (upper left-hand panel) or n(H2) = 107 cm−3 (upper middle panel). As in Fig. 1, the lower panels show the difference between the temperatures for clarity. The right-hand panel displays the volume density profile at the two central density values in simulation M_TD; the corresponding profiles in simulations M_10 and M_0 are only marginally different to those shown here.
Current usage metrics show cumulative count of Article Views (full-text article views including HTML views, PDF and ePub downloads, according to the available data) and Abstracts Views on Vision4Press platform.
Data correspond to usage on the plateform after 2015. The current usage metrics is available 48-96 hours after online publication and is updated daily on week days.
Initial download of the metrics may take a while.