Fig. 1
Download original image
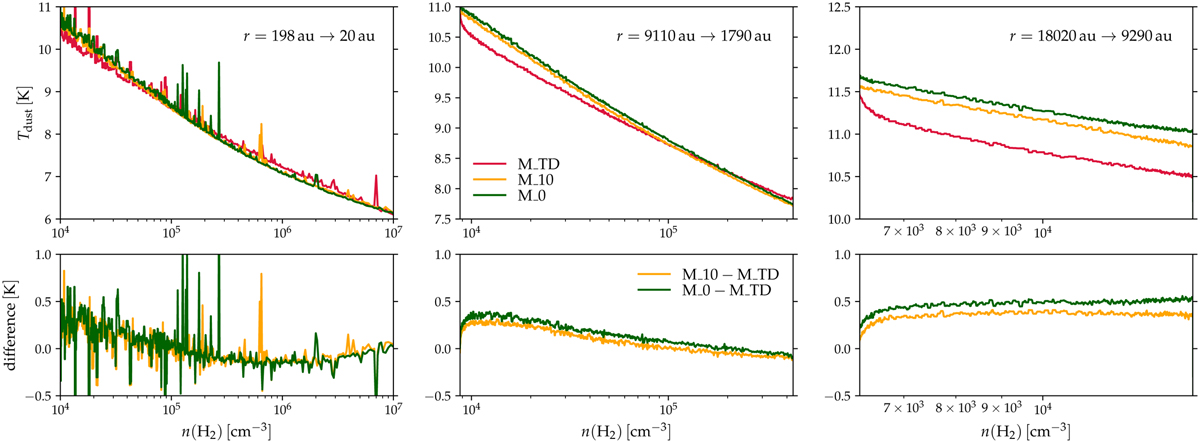
Evolution of Tdust as a function of the volume density in three model cells in simulations M_TD, M_10, and M_0 (upper panels). The volume density in each cell increases as a function of time due to infall, and hence the time advances to the right. The time itself is not shown because the simulations evolve at different rates (it takes a different amount of time to reach a certain volume density) and hence a common reference time cannot be defined easily. Each cell starts out at a different location in the core; the initial and final location are given in the upper right corner in each panel. The quoted values correspond to simulation M_TD. The corresponding locations in the other two simulations deviate by less than ten per cent from these values despite the different overall evolution of the cores. The lower panels show the difference of the temperature curves as given in the middle bottom panel.
Current usage metrics show cumulative count of Article Views (full-text article views including HTML views, PDF and ePub downloads, according to the available data) and Abstracts Views on Vision4Press platform.
Data correspond to usage on the plateform after 2015. The current usage metrics is available 48-96 hours after online publication and is updated daily on week days.
Initial download of the metrics may take a while.