Fig. 2.
Download original image
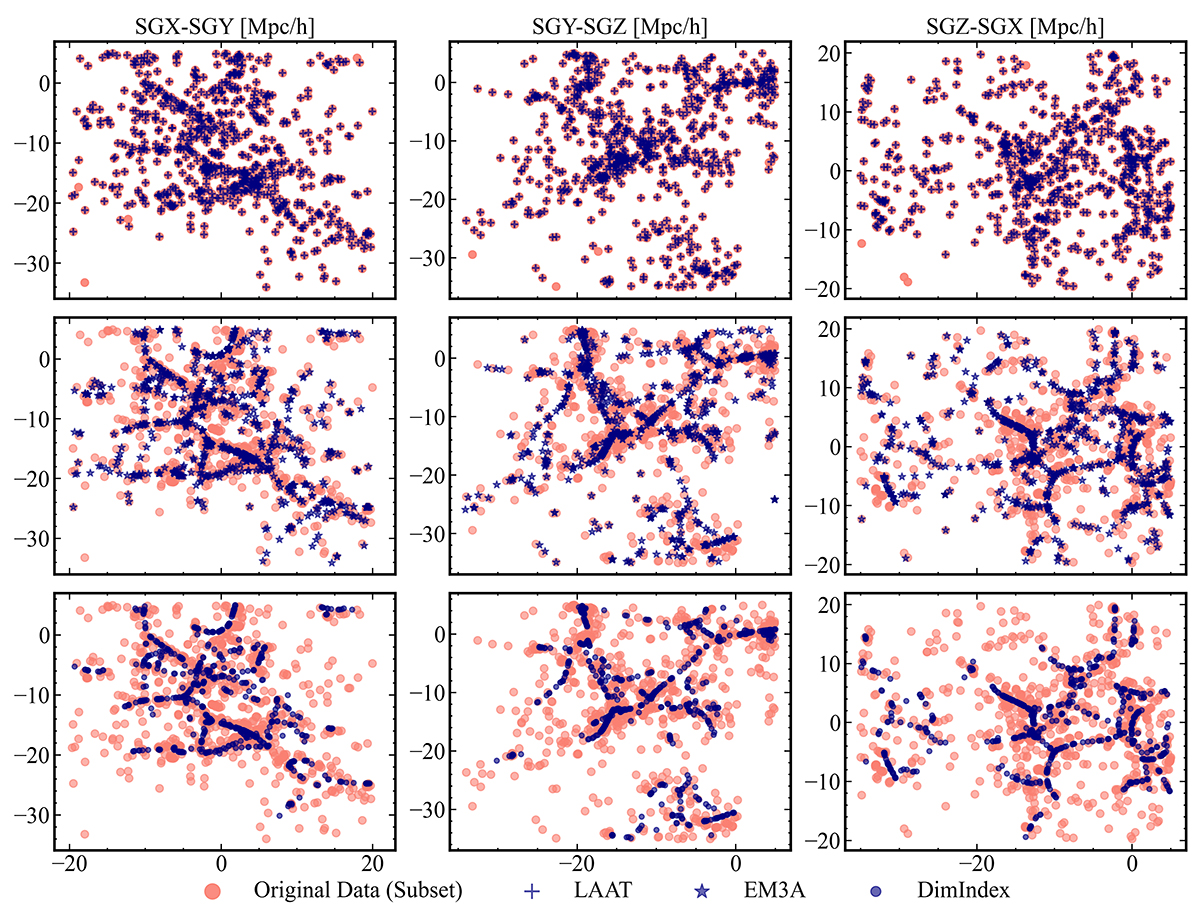
Results of LAAT, EM3A, and DimIndex algorithms applied to our data. The first row depicts the structures highlighted by LAAT compared to the original distribution of galaxies. The second row shows the axes enhanced by EM3A. The third row shows the remaining 1D structures found by DimIndex. The results of each algorithm is drawn in blue and compared to the original distribution of data drawn in orange. From left to right, we show the projections along the x − y, y − z, and z − x planes.
Current usage metrics show cumulative count of Article Views (full-text article views including HTML views, PDF and ePub downloads, according to the available data) and Abstracts Views on Vision4Press platform.
Data correspond to usage on the plateform after 2015. The current usage metrics is available 48-96 hours after online publication and is updated daily on week days.
Initial download of the metrics may take a while.