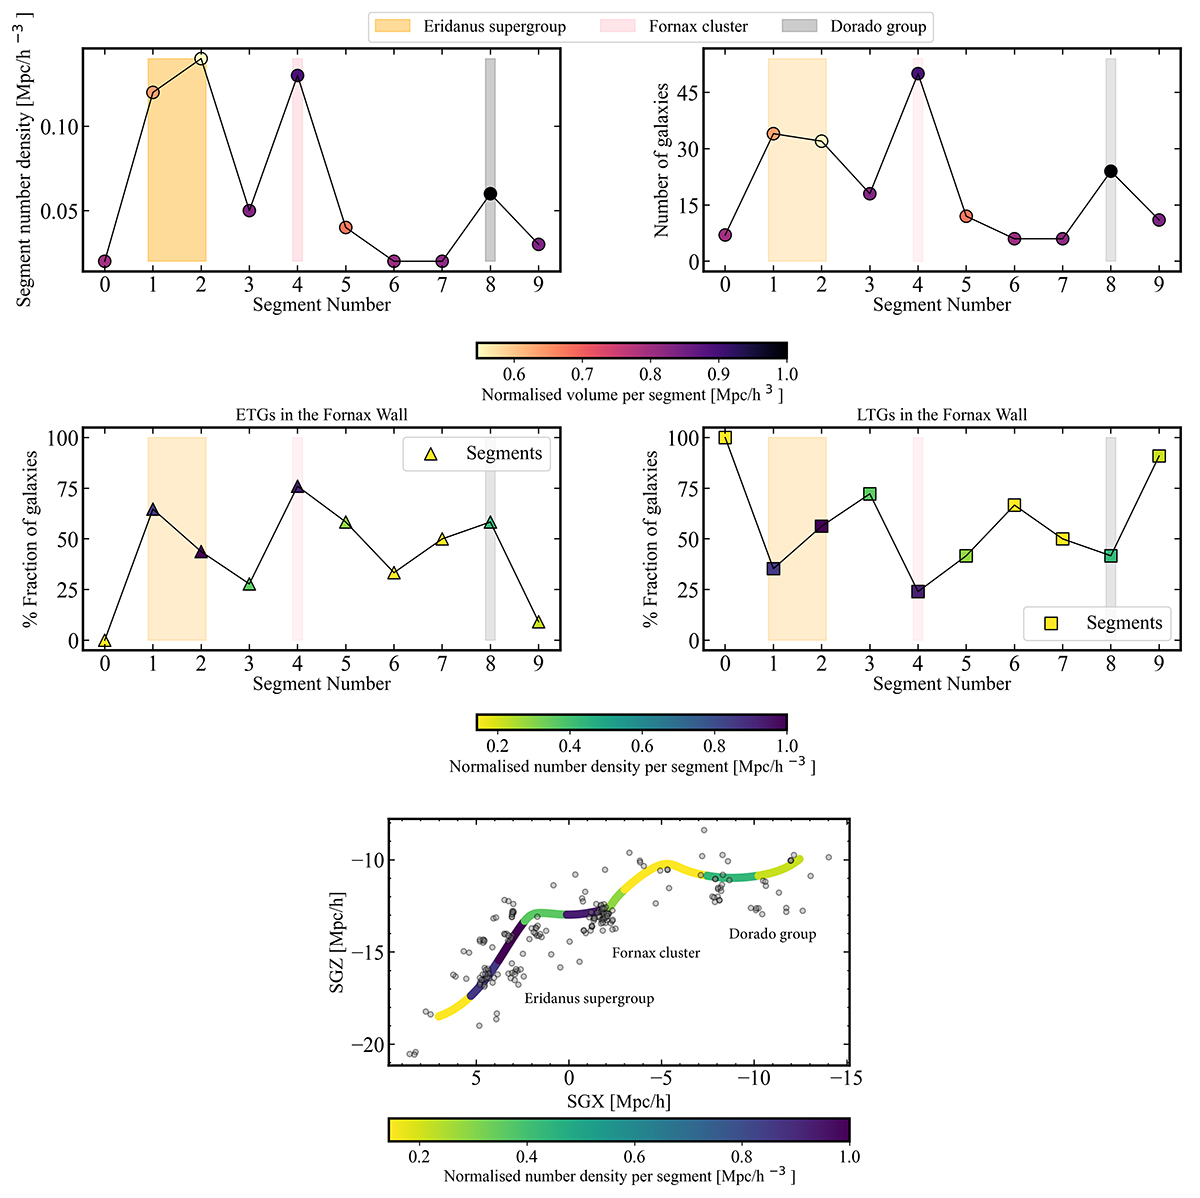
Fig. 12.
Download original image
Morphology-density relation of galaxies part of the Fornax Wall. Top panel: x-axes represent the segment number corresponding to Fig. 11 and y-axis represents the segment number density on the left and number of galaxies on the right. The colour bar indicates the normalised volume per segment. The major systems as indicated in Fig. 11 are also highlighted here – Eridanus supergroup in orange, Fornax cluster in pink, and Dorado group in grey; Middle panel: Fraction of ETGs (left) and LTGs (right) in each segment. The colour bar indicates the normalised number density per segment; Lower panel: Fornax Wall and its constituent galaxies, projected in the supergalactic x-z plane. Each segment is coloured according to its density; the colour bar depicts the normalised density.
Current usage metrics show cumulative count of Article Views (full-text article views including HTML views, PDF and ePub downloads, according to the available data) and Abstracts Views on Vision4Press platform.
Data correspond to usage on the plateform after 2015. The current usage metrics is available 48-96 hours after online publication and is updated daily on week days.
Initial download of the metrics may take a while.