Open Access
Fig. 4.
Download original image
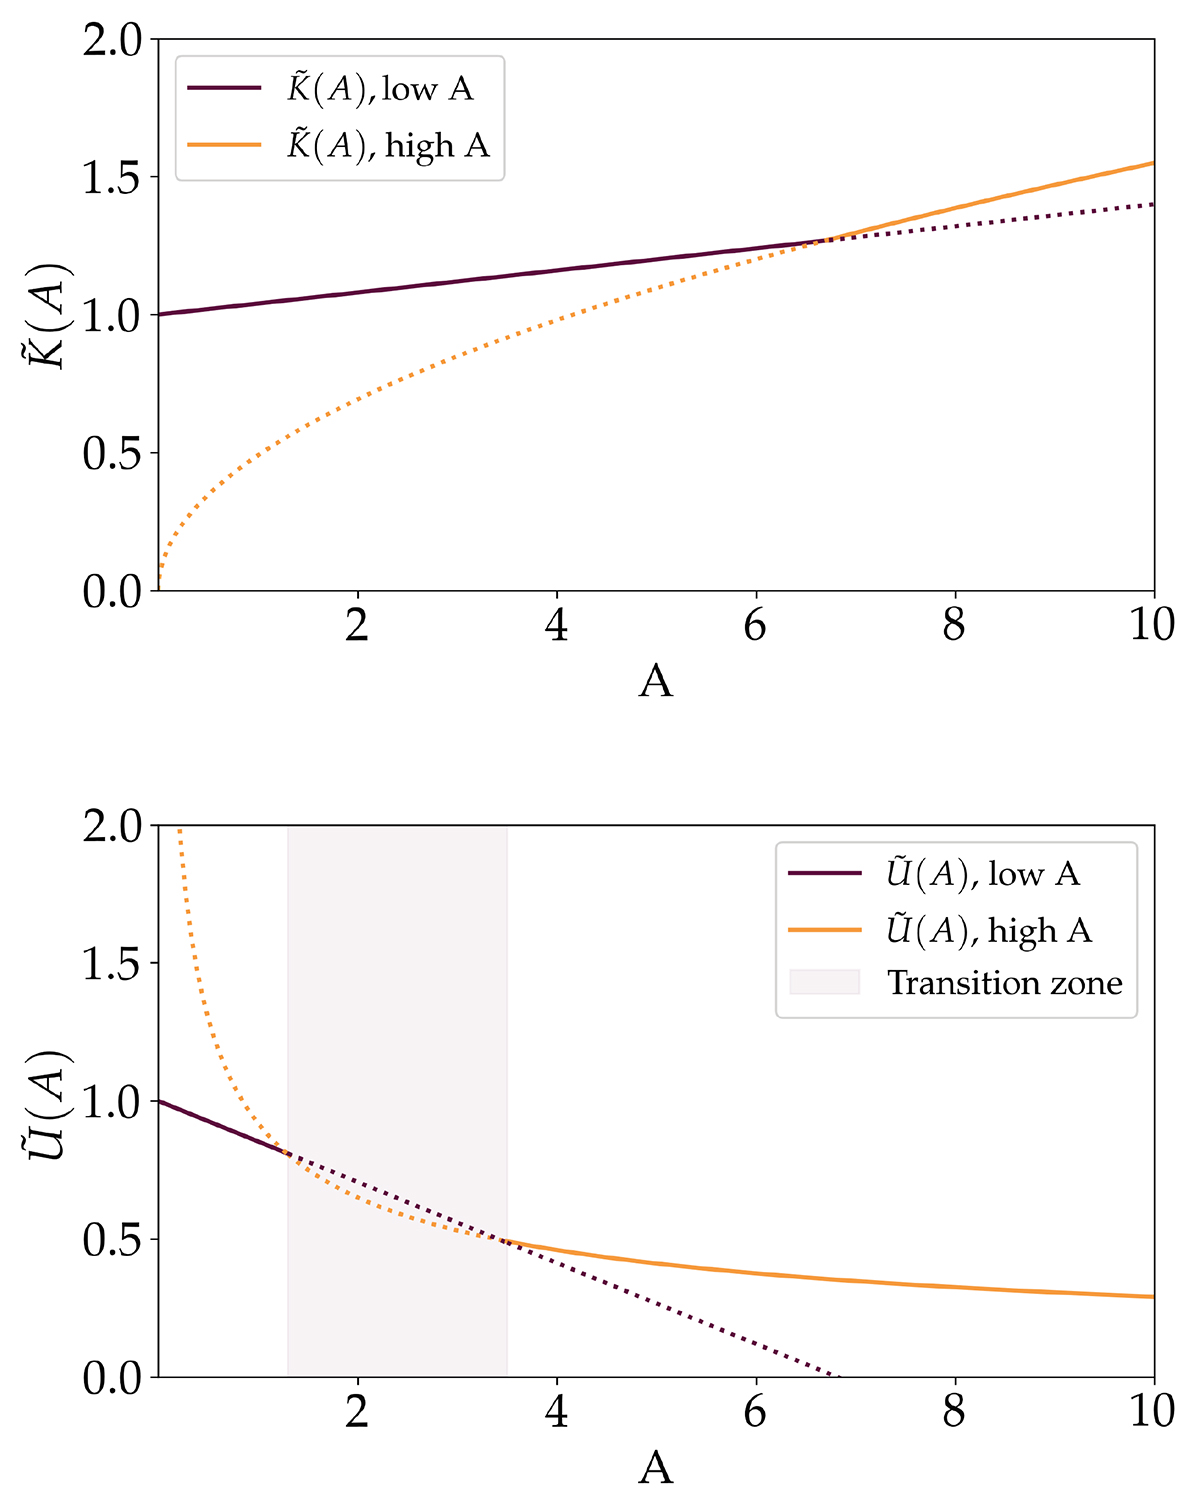
Scaling laws given by Stevenson for the change in (top) wavenumber ![]() and (bottom) in convective velocity
and (bottom) in convective velocity ![]() . The grey zone in the bottom figure, between A = 1, 28 and A = 3, 43, shows the transition region, in which the low-A and the high-A prescription cannot be clearly distinguished.
. The grey zone in the bottom figure, between A = 1, 28 and A = 3, 43, shows the transition region, in which the low-A and the high-A prescription cannot be clearly distinguished.
Current usage metrics show cumulative count of Article Views (full-text article views including HTML views, PDF and ePub downloads, according to the available data) and Abstracts Views on Vision4Press platform.
Data correspond to usage on the plateform after 2015. The current usage metrics is available 48-96 hours after online publication and is updated daily on week days.
Initial download of the metrics may take a while.